LightningChart JS DataGrid
Flexible and customizable data grid component for advanced visualizations.
- Supports unlimited rows and columns for extensive data display.
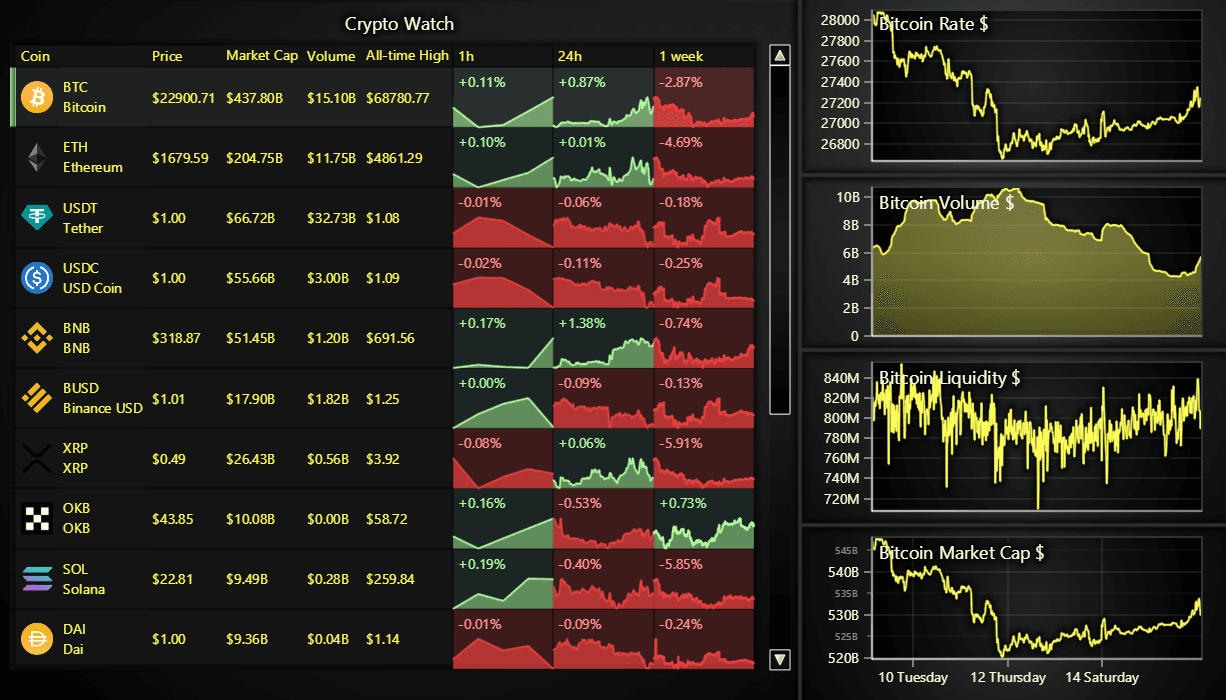
- Handles diverse cell content including spark charts and icons.
- Provides dynamic coloring and event-driven user interactions.

Prices from:
| Available in | |
|---|---|
| LightningChart JS | Loading |
Unlimited Rows and Columns
Supports an unrestricted number of rows and columns, enabling the display of large, complex datasets without limiting the grid's capacity.
Variety of Cell Content Types
Allows cell content to be text, numbers, images, icons, and various spark chart types such as line, bar, pie, area, and win-loss charts to enrich data presentation.
Cell Merging Capability
Enables merging of adjacent cells to create unified blocks within the grid, improving organization and readability of related data.
Dynamic Coloring and Heatmaps
Supports dynamic background and cell coloring based on data values, facilitating visual emphasis such as heatmap-style representations for quick data insight.
Extensive Styling Options
Offers full customization of cell fonts, padding, borders, and highlights, allowing precise control over the grid's appearance and user experience.
Event API for User Interaction
Exposes an event-driven API to track user actions like clicks and hovers on cells, enabling custom interactive behaviors such as drill-down menus.
Content Alignment Controls
Allows alignment settings for individual cells, entire rows, or columns, ensuring that displayed data is visually structured to user preferences.
Background and Layout Management
Supports configuring grid and engine background styles independently, alongside control over column widths, row heights, and space around the chart for layout flexibility.
Integration with LightningChart JS
Designed as an add-on compatible with LightningChart JS version 4.0 and above, the DataGrid seamlessly integrates with other visualizations for comprehensive dashboard solutions.
Product Compatibility
Review the details below to ensure this product is supported within your environment.
Component Type
- JavaScript
JavaScript Platform
- Angular
- React
- Vanilla JavaScript
- Vue.js
About LightningChart
LightningChart, founded in Finland, specializes in advanced data visualization libraries for developers and IT professionals. Since its inception, LightningChart has focused on delivering GPU-accelerated charting components for .NET, JavaScript, and Python, supporting web, desktop, server, and IoT environments. Its libraries are known for rapid rendering and the ability to handle massive datasets, making them popular in scientific, engineering, financial, and medical software. With a dedicated team and worldwide presence, LightningChart offers customizable visualization solutions that help users achieve exceptional performance and flexibility in modern application development.
Learn more about LightningChartExplore LightningChart products

As official and authorized distributors since 2021, ComponentSource supplies you with legitimate licenses directly from LightningChart.