TeeChart .NET for Avalonia
Create rich, cross-platform data visualizations with Avalonia charts.
- Supports over 60 customizable 2D and 3D chart types and variations.
- Includes financial, scientific, and statistical charting functions and indicators.
- Integrates seamlessly with Avalonia UI for Windows, Linux, and macOS apps.

Prices from:
| Available individually | Our Price |
|---|---|
| TeeChart .NET for Avalonia | Loading |
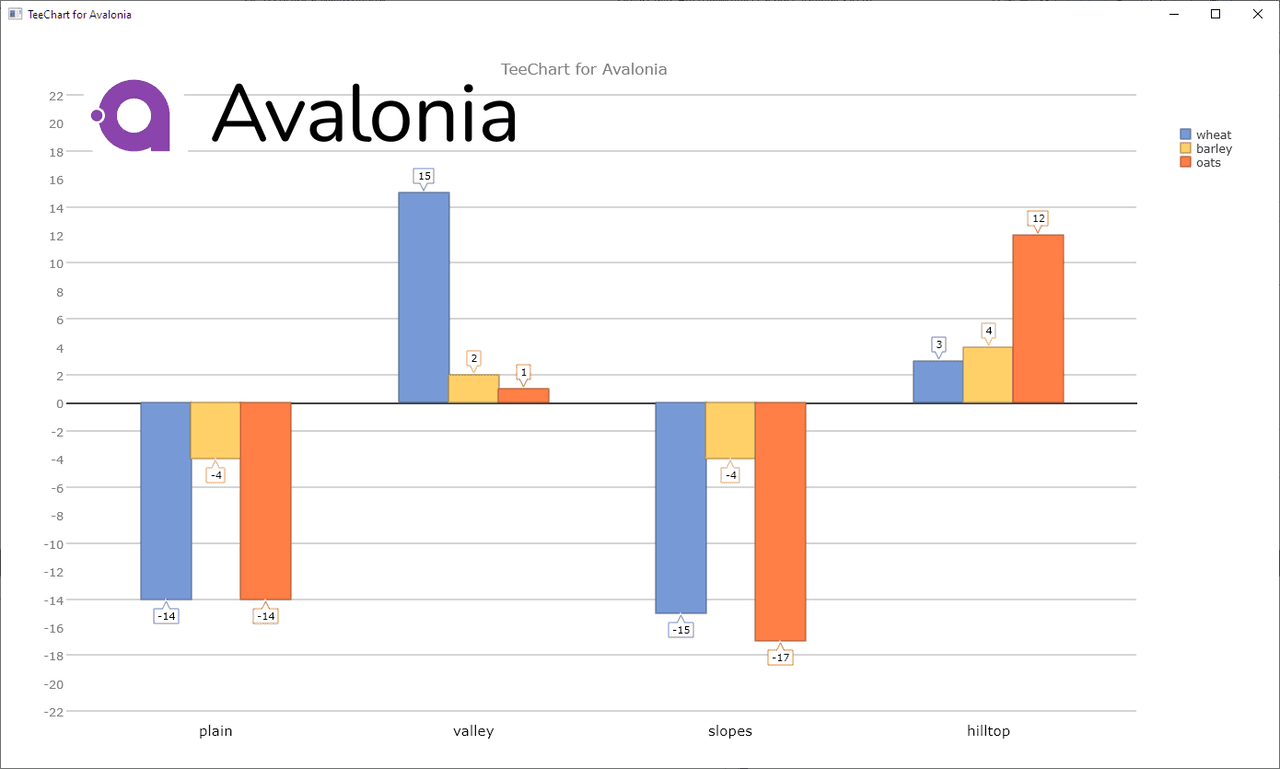
Extensive Chart Collection
Choose from over 60 chart types including 2D and 3D variations like Line, Bar, Pie, Candlestick, Kagi, and Map series, catering to diverse visualization needs in financial, scientific, and general domains.
Financial and Scientific Indicators
Utilize built-in mathematical indicators such as MACD, Bollinger Bands, and Moving Averages to analyze financial data, plus advanced statistical functions supporting scientific data visualization.
Cross-Platform Compatibility
Build native applications targeting Windows, Linux, and macOS with Avalonia UI, while leveraging the same charting components and codebase for consistent visuals and behaviors.
Avalonia UI Integration
Seamlessly use C# and XAML to customize charts within Avalonia's flexible, MVVM-friendly framework, taking advantage of its comprehensive styling system and modern UI features.
Comprehensive Gauge and Map Support
Incorporate configurable gauge indicators including circular and linear styles for dashboards, alongside map series supporting ESRI open standard formats for geographic data visualization.
Rich Data Connectivity
Connect charts directly to .NET data sources or local databases and datasets, simplifying integration of real-time or stored data into visualizations.
Powerful Chart Tools and Customization
Enhance interactivity and appearance with tools such as zoom, scroll, annotations, and animations, along with control over color palettes, legends, multiple axes, and image filters.
Flexible Exporting Options
Export charts to various image formats like PNG, JPEG, SVG, PDF, and data formats including Excel, XML, and CSV, enabling easy sharing and reporting.
Performance and Efficiency
Benefit from fast, memory-efficient rendering optimized for Avalonia with direct high-speed data addition using array inputs.
Support and Licensing
Access comprehensive documentation, coded examples, and community forums, along with a royalty-free license for distributing compiled applications using TeeChart .NET for Avalonia.
Product Compatibility
Review the details below to ensure this product is supported within your environment.
Component Type
- .NET
.NET Version
- .NET 10 LTS
- .NET 9 STS
- .NET 8 LTS
.NET Platform
- Avalonia UI
IDE Support
- Rider
- Visual Studio
About Steema Software
Steema Software, founded in 1995 and based in Girona, Spain, delivers charting and data visualization components to developers worldwide. It is recognized for its award-winning TeeChart library, which has become a staple in environments like Delphi, C++ Builder, Microsoft Visual Studio, .NET, Java, and PHP. Steema’s components facilitate highly dynamic and interactive charting across desktop, web, and mobile platforms. With a strong commitment to customer relationships and technical support, Steema continues to enhance its comprehensive suite, serving the evolving needs of software developers and IT professionals.
Learn more about Steema SoftwareExplore Steema Software products

As official and authorized distributors since 1998, ComponentSource supplies you with legitimate licenses directly from Steema Software.