


Proveedor oficial
Como distribuidores oficiales y autorizados, le suministramos licencias legítimas directamente de más de 200 editores de software.
Ver todas nuestras marcas.
Continuar leyendo en inglés:
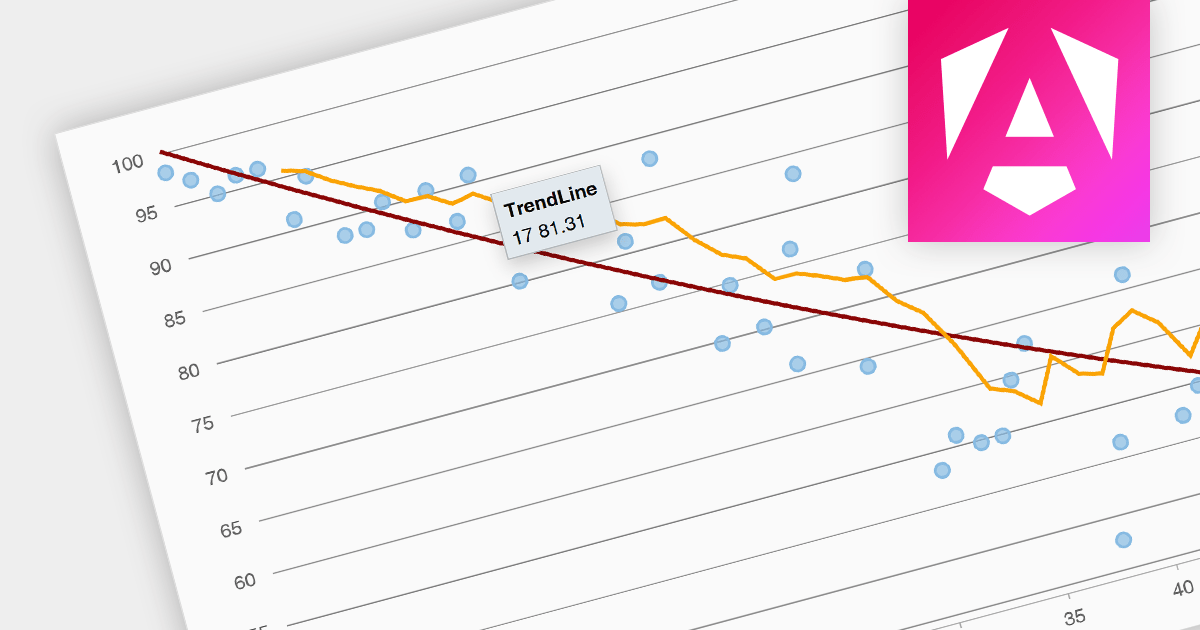
Trend lines are a chart feature used to indicate patterns or trends in data over time. Common examples include linear, exponential, polynomial, logarithmic, and moving average. Trend lines are crucial for making predictions or understanding the direction of data points in scatter plots and line charts, helping make data-driven decisions.
Several Angular chart components provide trend line support including:
For an in-depth analysis of features and price, visit our Angular Chart Component comparison.
Tel: (888) 850 9911
Fax: +1 770 250 6199


