


Proveedor oficial
Como distribuidores oficiales y autorizados, le suministramos licencias legítimas directamente de más de 200 editores de software.
Ver todas nuestras marcas.
Continuar leyendo en inglés:
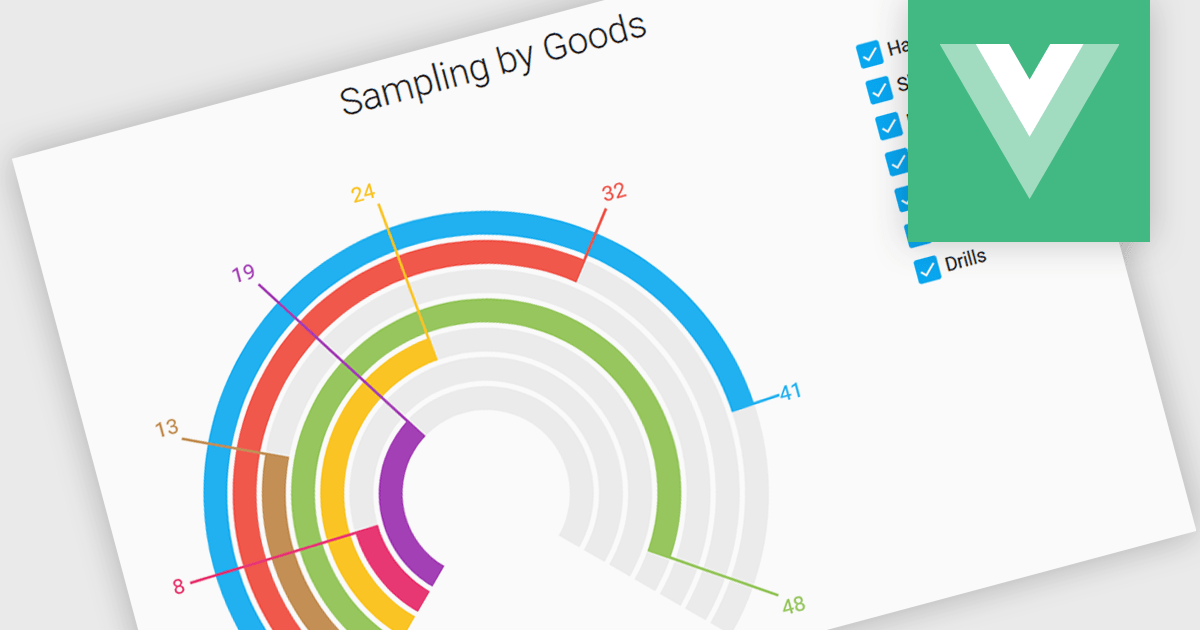
Gauge controls are visual components employed in software development to represent numerical data in a graphical format. They effectively communicate quantitative information at a glance, aiding rapid decision-making. Common types include radial, linear, and circular gauges. Primarily utilized in dashboards and monitoring interfaces, gauges excel at displaying performance metrics, system health indicators, and real-time data trends. Their intuitive design enhances user experience by providing immediate insights into key performance indicators (KPIs) and facilitating efficient analysis.
Several Vue.js UI suites offer gauge controls including:
For an in-depth analysis of features and price, visit our Vue.js UI suites comparison.
Tel: (888) 850 9911
Fax: +1 770 250 6199


