


Proveedor oficial
Como distribuidores oficiales y autorizados, le suministramos licencias legítimas directamente de más de 200 editores de software.
Ver todas nuestras marcas.
Continuar leyendo en inglés:
ComponentOne Studio Enterprise by MESCIUS is a comprehensive toolkit for .NET developers, offering a vast collection of pre-built UI controls for desktop (WinForms, WPF, WinUI, UWP), web (ASP.NET MVC, ASP.NET Core, MVC, Blazor), and mobile (.NET MAUI, Xamarin) applications. It extends functionality beyond UI with data visualization tools, data grids, reporting components, and JavaScript controls through Wijmo Enterprise. This all-in-one solution streamlines development by providing pre-designed elements and functionalities, allowing developers to focus on core application logic and deliver feature-rich applications faster.
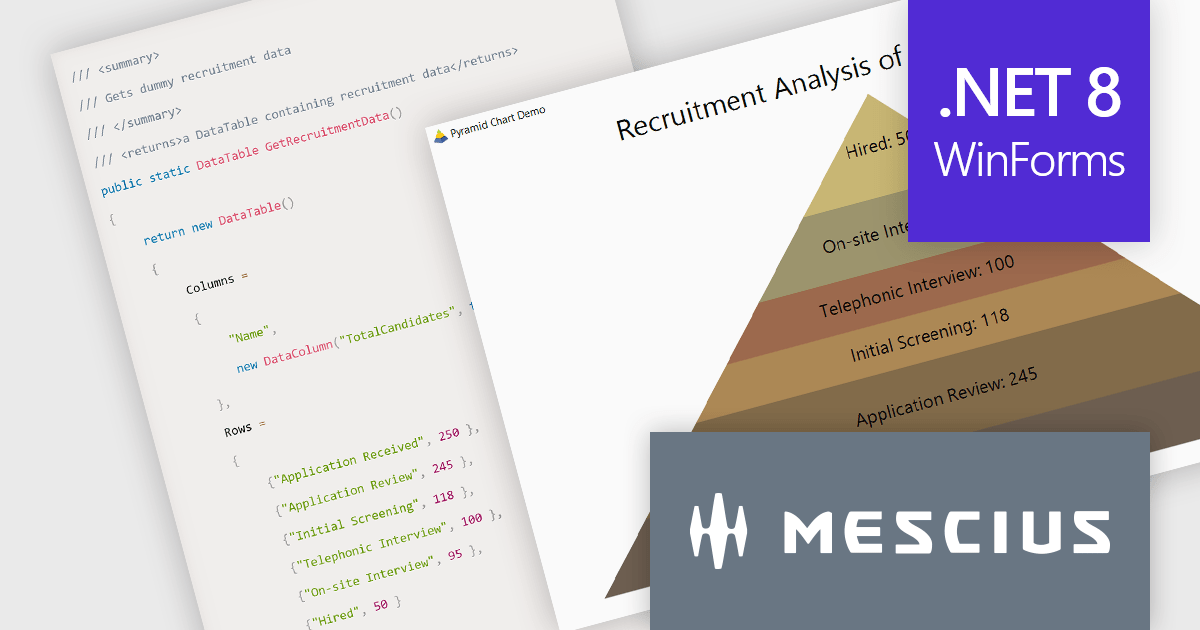
In this blog post, MESCIUS Associate Software Engineer Aastha Gupta demonstrates how to use the ComponentOne FlexChart control in C# .NET to create a pyramid chart. Steps include:
Detailed sample code is included and there is even a sample app that you can download to make it easier.
Read the complete blog to get started creating stunning visualizations of hierarchical data.
ComponentOne Studio Enterprise is licensed per developer on a perpetual basis and includes a 12 month subscription. Priority Support is also available. See our ComponentOne Studio Enterprise licensing page for full details.
Learn more on our ComponentOne Studio Enterprise product page.
Tel: (888) 850 9911
Fax: +1 770 250 6199


