


Proveedor oficial
Como distribuidores oficiales y autorizados, le suministramos licencias legítimas directamente de más de 200 editores de software.
Ver todas nuestras marcas.
Continuar leyendo en inglés:
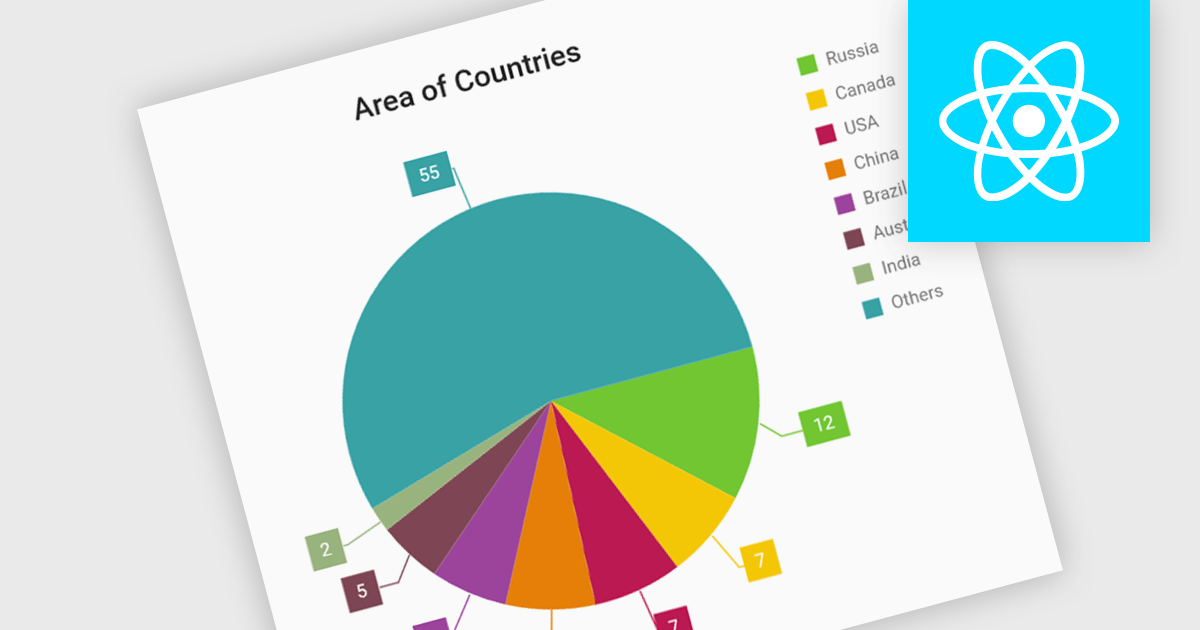
Pie charts are circular diagrams that visually represent data as slices of a whole. Each slice represents a category, with its size proportional to its share of the total. They are particularly effective for illustrating categorical data, such as market shares, demographics, or budget allocations. Pie charts offer a clear and intuitive way to compare relative quantities, making it easy to identify the dominant categories and their contributions to the overall composition.
Several React chart controls offer pie charts including:
For an in-depth analysis of features and price, visit our React chart controls comparison.
Tel: (888) 850 9911
Fax: +1 770 250 6199


