


Proveedor oficial
Como distribuidores oficiales y autorizados, le suministramos licencias legítimas directamente de más de 200 editores de software.
Ver todas nuestras marcas.
Continuar leyendo en inglés:
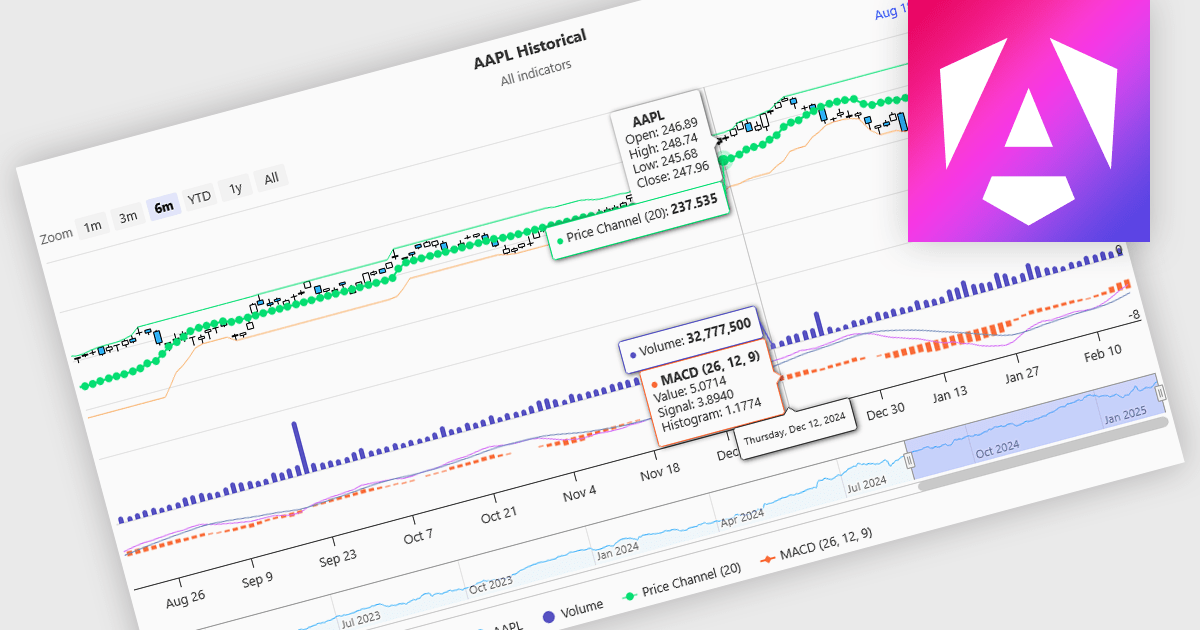
Indicators in a financial chart are mathematical formulas applied to market data, such as price and volume, to generate insights into trends, momentum, volatility, and trade opportunities. Indicators are visualized as lines, histograms, or overlays on the chart, providing dynamic analysis rather than static points. Moving averages track price trends with smooth lines, while oscillators like RSI appear as separate graphs to measure momentum. These tools help traders analyze patterns, confirm price movements, and support decision-making. For software developers, integrating indicators enhances data visualization, enables algorithmic trading strategies, and improves user experience by delivering clear, actionable insights.
Several Angular charting components provide support for indicators within financial charts, including:
For an in-depth analysis of features and price, visit our Angular chart components comparison.
Tel: (888) 850 9911
Fax: +1 770 250 6199


