Proveedor oficial
Como distribuidores oficiales y autorizados, le suministramos licencias legítimas directamente de más de 200 editores de software.
Ver todas nuestras marcas.

Continuar leyendo en inglés:
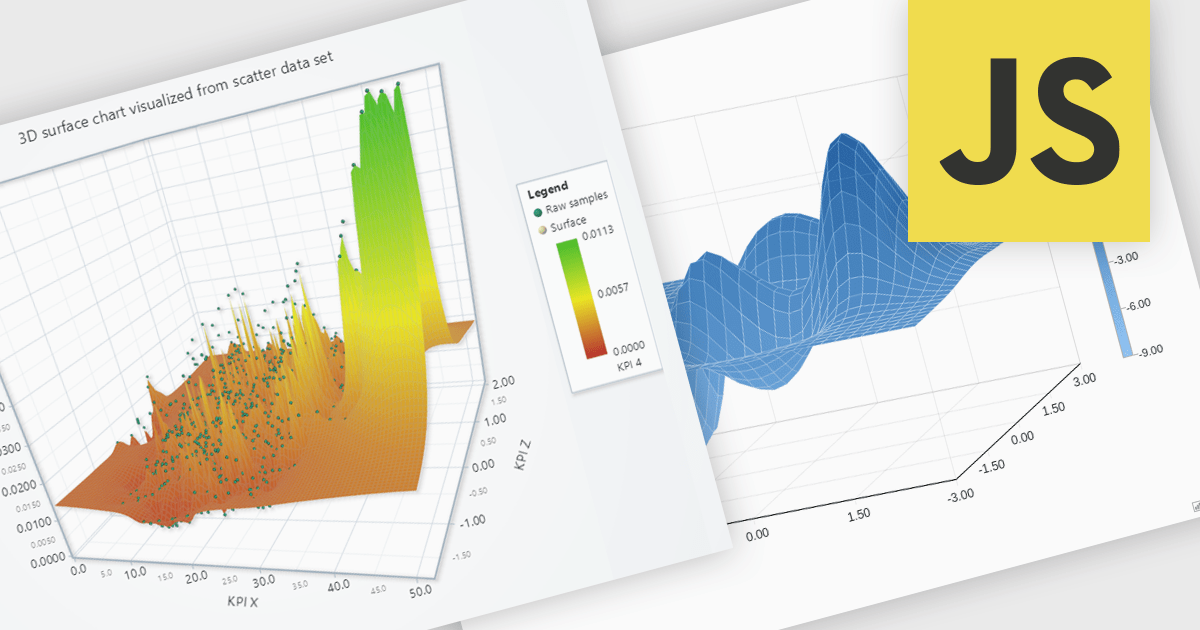
Surface charts are 3D visualizations that show relationships between three numerical variables as a continuous surface. They help identify trends and optimal values, making them useful in science, engineering, and business. Common uses include topographical mapping, financial modeling, and performance analysis. For example, businesses can use surface charts to analyze how price and demand affect revenue, helping them find the best price point. By displaying data in three dimensions, surface charts reveal insights that may not be clear in 2D charts.
Several JavaScript chart controls offer support for Surface charts, including:
For an in-depth analysis of features and price, visit our JavaScript chart controls comparison.