


Proveedor oficial
Como distribuidores oficiales y autorizados, le suministramos licencias legítimas directamente de más de 200 editores de software.
Ver todas nuestras marcas.
Continuar leyendo en inglés:
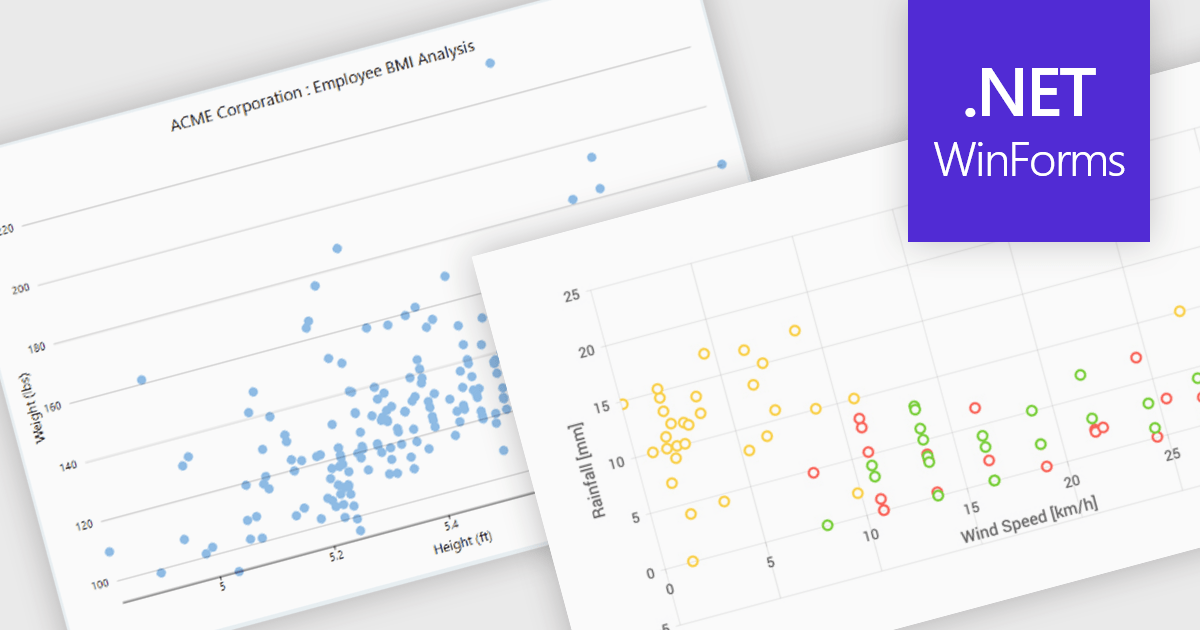
Scatter charts, also known as scatter plots or scatter diagrams, are fundamental visualization tools used to explore the relationship between two continuous variables by plotting data points, where each point's position is determined by its corresponding values for the two variables. This visual representation effectively reveals correlations and helps identify outliers, clusters, and the overall range and distribution of the data. The benefits of using scatter charts include their simplicity in conveying complex relationships, their ability to highlight anomalies that might be missed in tabular data, and their role as a precursor to more advanced statistical analyses like regression.
Several .NET WinForms chart controls offer scatter charts including:
For an in-depth analysis of features and price, visit our .NET WinForms chart controls comparison.
Tel: (888) 850 9911
Fax: +1 770 250 6199


