


Proveedor oficial
Como distribuidores oficiales y autorizados, le suministramos licencias legítimas directamente de más de 200 editores de software.
Ver todas nuestras marcas.
Continuar leyendo en inglés:
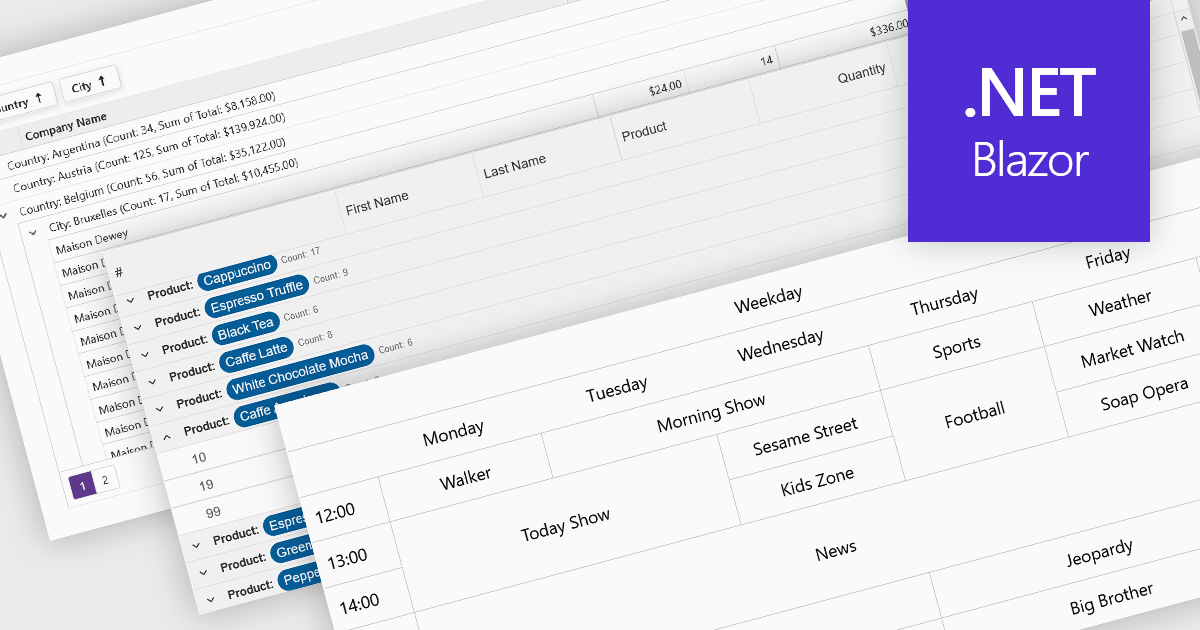
Data visualization and analysis features in grid components transform raw tabular data into structured, interpretable formats that support faster insights and decision-making. These features go beyond static display, offering dynamic ways to organize, summarize, and explore data directly within the grid interface, making it a powerful tool for both end-users and analysts.
Common features include:
For an in-depth analysis of features and price, visit our Blazor grid components comparison.
Tel: (888) 850 9911
Fax: +1 770 250 6199


