


Proveedor oficial
Como distribuidores oficiales y autorizados, le suministramos licencias legítimas directamente de más de 200 editores de software.
Ver todas nuestras marcas.
Continuar leyendo en inglés:
Syncfusion Essential Studio JavaScript is a comprehensive UI library offering over 80 high-performance, lightweight, and responsive components to transform your web apps. Built from scratch with TypeScript, it boasts modularity and touch-friendliness, letting you pick and choose specific features while ensuring smooth mobile interaction. With rich themes, global accessibility features, and extensive documentation, it powers everything from basic buttons to interactive charts and data grids, simplifying frontend development across JavaScript, Angular, React, and Vue.
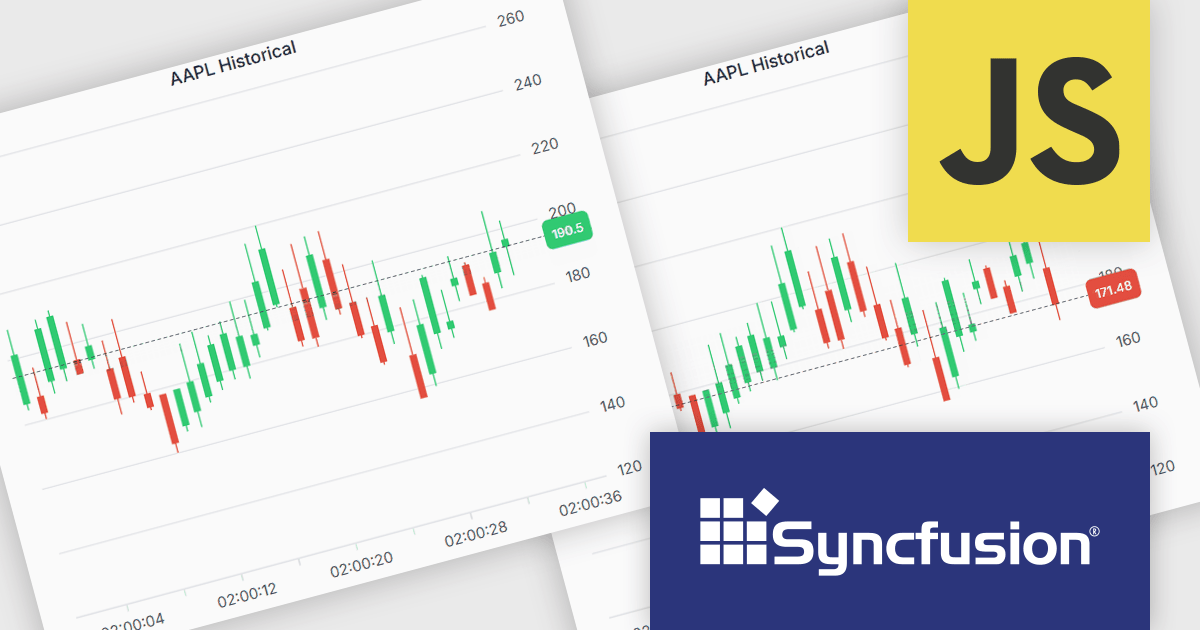
The Syncfusion Essential Studio JavaScript 2025 Volume 2 update introduces support for highlighting the last value of a series in the Chart component with a label and a grid line indicator. This makes it easier for users to identify the most recent data point at a glance, improving chart readability without requiring interaction. It’s especially useful in scenarios like financial dashboards or performance tracking where the latest value is the key focus.
To see a full list of what's new in 2025 Volume 2 (30.1.37), see our release notes.
Syncfusion Essential Studio JavaScript is available as part of Syncfusion Essential Studio Enterprise which is licensed per developer starting with a Team License of up to five developers. It is available as a 12 Month Timed Subscription License which includes support and maintenance. See our Syncfusion Essential Studio Enterprise licensing page for full details.
Learn more on our Syncfusion Essential Studio JavaScript product page.
Tel: (888) 850 9911
Fax: +1 770 250 6199


