













Proveedor oficial
Como distribuidores oficiales y autorizados, le suministramos licencias legítimas directamente de más de 200 editores de software.
Ver todas nuestras marcas.
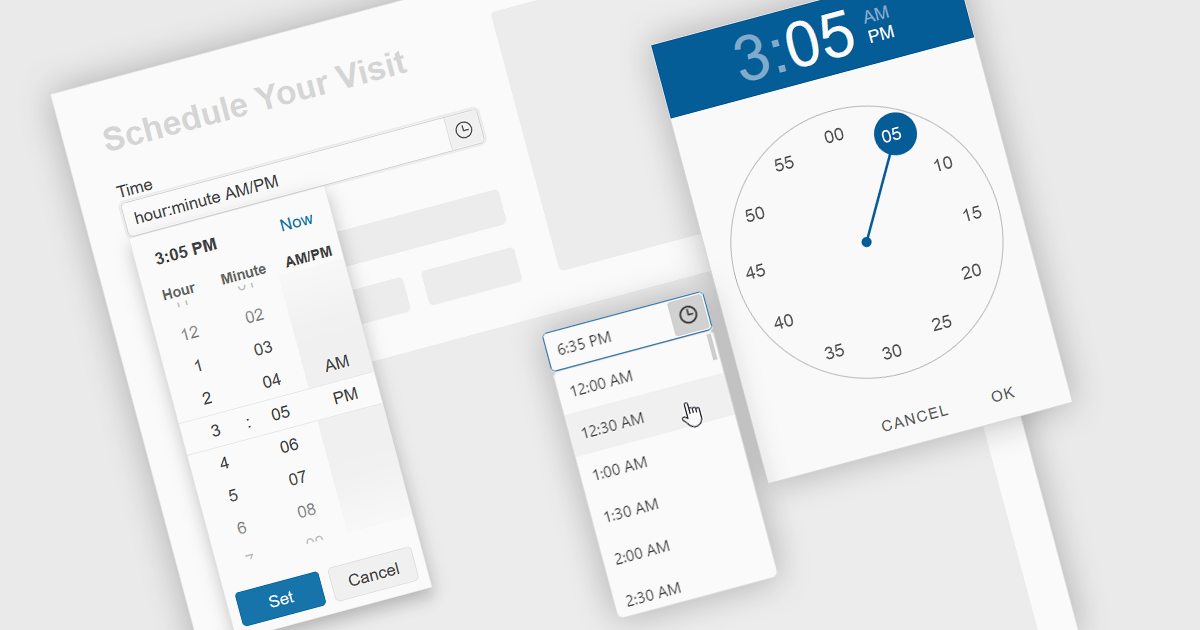
A time picker is an input component that provides users with the ability to edit or select a specific time value from a visual dropdown or input field, typically presented in the form of a clock face or a digital time display. This user interface element provides a standardized and intuitive method for capturing time input, ensuring that the data is consistent, accurate and correctly formatted. Particularly valuable in applications involving scheduling tools, booking systems or simply managing time-based data, it enhances the overall user experience and helps to ensure accurate and efficient data entry.
Several Angular data editor collections provide time picker components, including:
For an in-depth analysis of features and price, visit our comparison of Angular data editors.
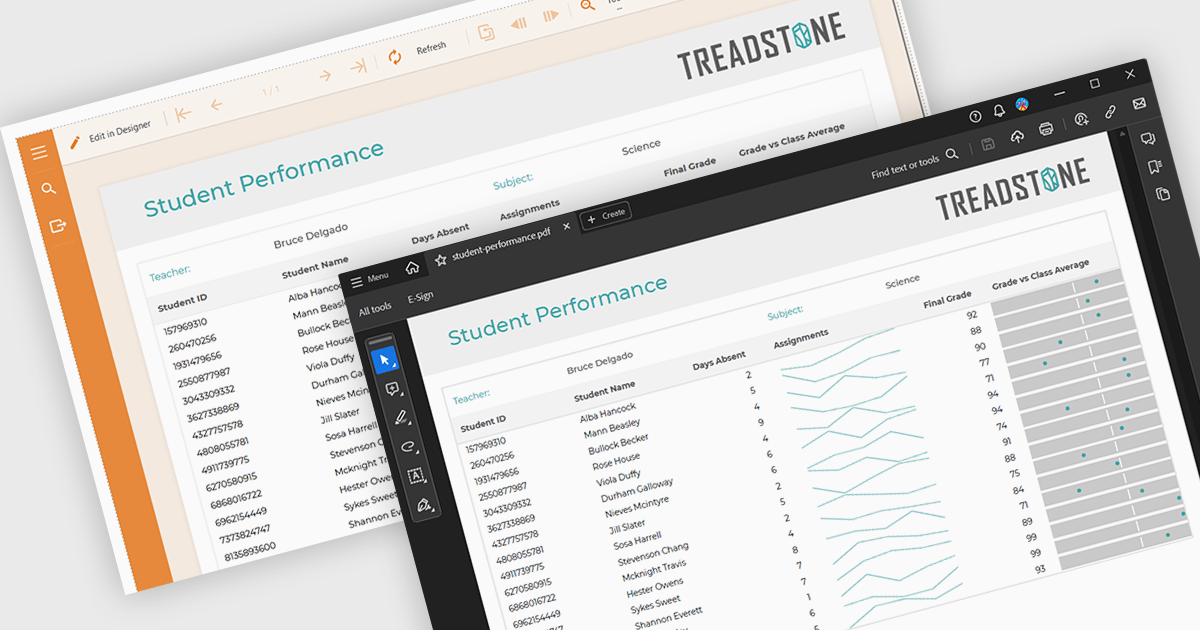
PDF export functionality within a reporting component enables the transformation of generated report data into a portable, high-fidelity PDF document. This capability offers significant advantages, including standardized document format compatibility, enhanced security through encryption options, optimized file size for efficient storage and transmission, and preservation of complex layout and formatting, ensuring consistent visual representation across different platforms and devices.
Several Angular reporting components offer PDF export support including:
For an in-depth analysis of features and price, visit Angular reporting components comparison.
Infragistics Ignite UI for Angular is a comprehensive suite of Angular components and UI controls designed to accelerate development of high-performance, enterprise-grade web applications. It offers a rich collection of data grids, charts, and other UI elements, along with advanced features like pivoting, docking, and hierarchical data management. Built on Angular, the toolkit integrates seamlessly into existing projects and provides a foundation for building modern, responsive, and interactive user interfaces.
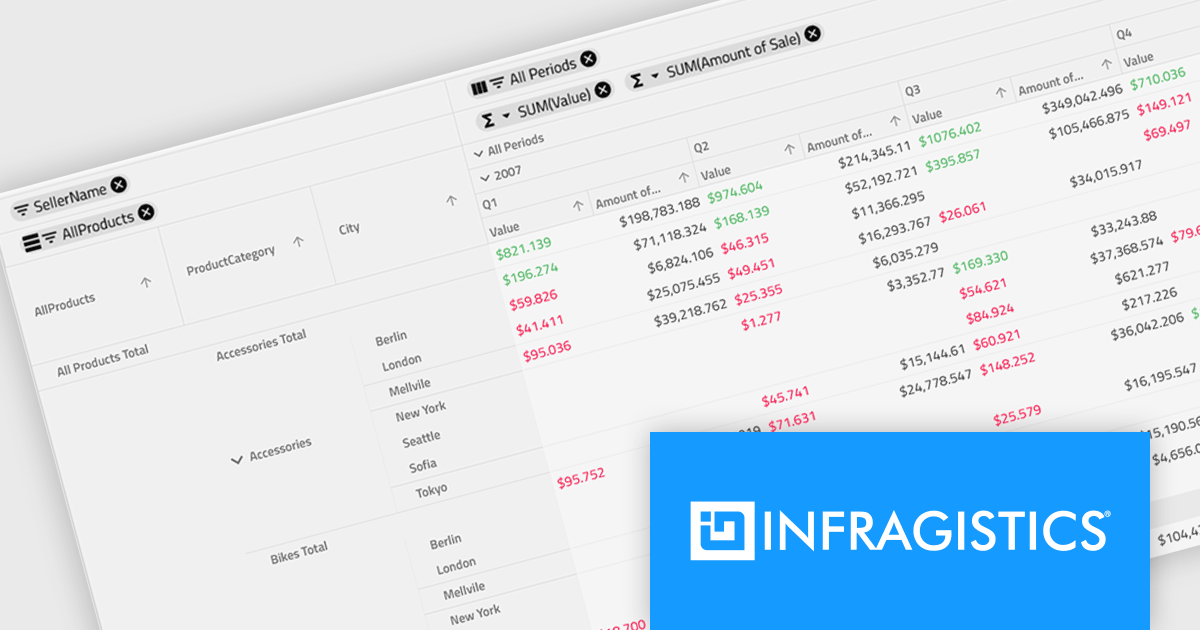
Ignite UI for Angular's Pivot Grid now offers horizontal row dimension expansion, providing developers with greater flexibility in data visualization. In this mode, child elements of a row dimension are displayed horizontally within the same multi-row layout instead of vertically. This approach allows for a more compact and potentially informative representation of hierarchical data, enabling users to easily compare related data points within a single row context. Developers can dynamically toggle between horizontal and vertical expansion modes to suit their specific data analysis requirements.
To see a full list of what's new in version 24.1 (18.1.0), see our release notes.
Infragistics Ignite UI for Angular is part of Infragistics Ignite UI which is licensed per developer and is available as a Perpetual License with a 1, 2 or 3 year support and maintenance subscription. See our Infragistics Ignite UI licensing page for full details.
Infragistics Ignite UI for Angular is available in the following products:
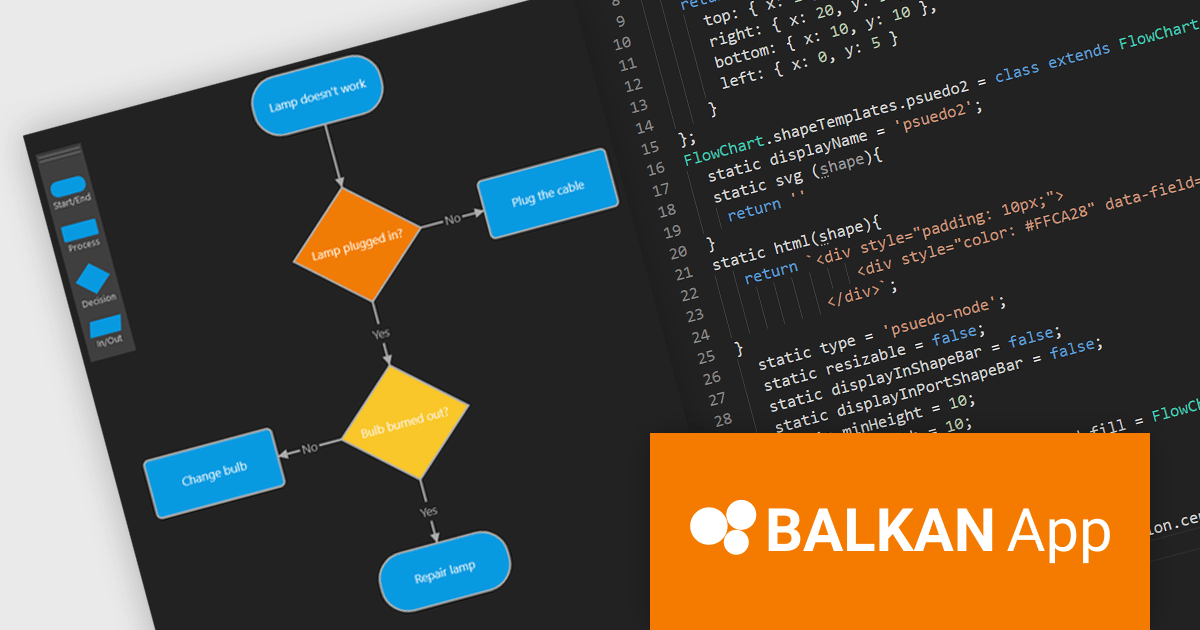
FlowChart JS, a powerful new JavaScript library from BALKAN App, the creators of OrgChart JS, is designed to streamline the creation of interactive and customizable flowcharts. It seamlessly integrates with React, Angular, and Vue.js, offering an intuitive drag-and-drop interface and real-time visual editing, making it easy to visualize complex processes and systems. The library provides a rich set of pre-built shapes and nodes, with the flexibility to create custom shapes, advanced connection and routing options, and a robust API. Its seamless integration into existing applications simplifies the development of clear, structured visualizations.
This new product streamlines the flowchart creation process and enhances visual communication, enabling users to quickly assemble intricate diagrams without extensive coding knowledge. The library's flexibility makes it suitable for a wide range of use cases including business process modeling, software development, educational materials, and technical documentation. By transforming complex information into visually appealing and understandable diagrams, FlowChart JS improves collaboration, decision-making, and problem-solving, providing JavaScript applications with powerful data visualization capabilities.
FlowChart JS is licensed on a perpetual basis with 1 year support and maintenance. Single website, unlimited websites or SaaS, and OEM licenses are available. See our FlowChart JS licensing page for full details.
For more information, see our FlowChart JS product page.
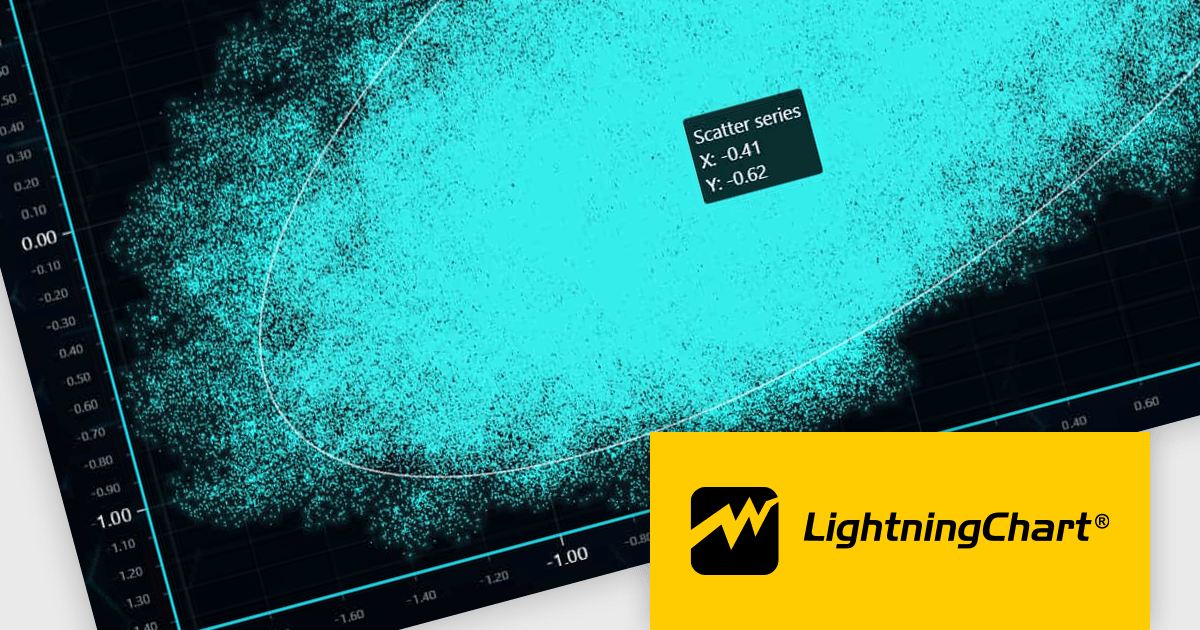
LightningChart JS is a high-performance JavaScript charting library optimized for real-time data visualization. Leveraging WebGL and GPU acceleration, it enables developers to create interactive, complex charts capable of handling massive datasets with high refresh rates. Ideal for applications demanding rapid data updates and smooth interactions, LightningChart JS provides a robust API for customization and integration into web-based projects.
The LightningChart JS v6.0.0 update introduces enhanced cursor capabilities, providing developers with greater control over cursor behavior and appearance. New features include custom cursor shapes, dynamic cursor updates based on data points, and precise cursor positioning, allowing for more informative and interactive visualizations. These improvements facilitate the creation of tailored user experiences and enable developers to effectively convey complex data insights through intuitive cursor interactions.
LightningChart JS v6.0.0 cursor improvements include:
To see a full list of what's new in v6.0.0, see our release notes.
LightningChart JS is licensed based on method of deployment with options including SaaS Developer Licenses, Application Developer Licenses, and Publisher Developer Licenses. Each license is perpetual and includes 1 year subscription for technical support and software updates. See our LightningChart JS licensing page for full details.
Learn more on our LightningChart JS product page.
Tel: (888) 850 9911
Fax: +1 770 250 6199


