













Proveedor oficial
Como distribuidores oficiales y autorizados, le suministramos licencias legítimas directamente de más de 200 editores de software.
Ver todas nuestras marcas.

LightningChart JS Trader is a comprehensive charting solution specifically designed for building high-performance financial and trading applications in JavaScript. It equips developers with a rich set of financial charts, over 100 technical indicators for in-depth analysis, and 30+ drawing tools for visual annotations. Additionally, a fully featured datagrid with sparkline support allows for organized data management and display. This combination empowers developers to create interactive and visually engaging trading dashboards, charting tools, and other financial applications with high performance and extensive customization options.
LightningChart JS Trader features include:
LightningChart JS Trader is licensed per developer, per application, per year. The annual license includes technical support and product updates for one year. To continue using the software you will need to renew your license each year. There are three editions to choose from; Basic, Plus and Ultimate which offer different levels of functionality and distribution rights. See our LightningChart JS Trader Licensing page for full details.
For more information, visit our LightningChart JS Trader product page.
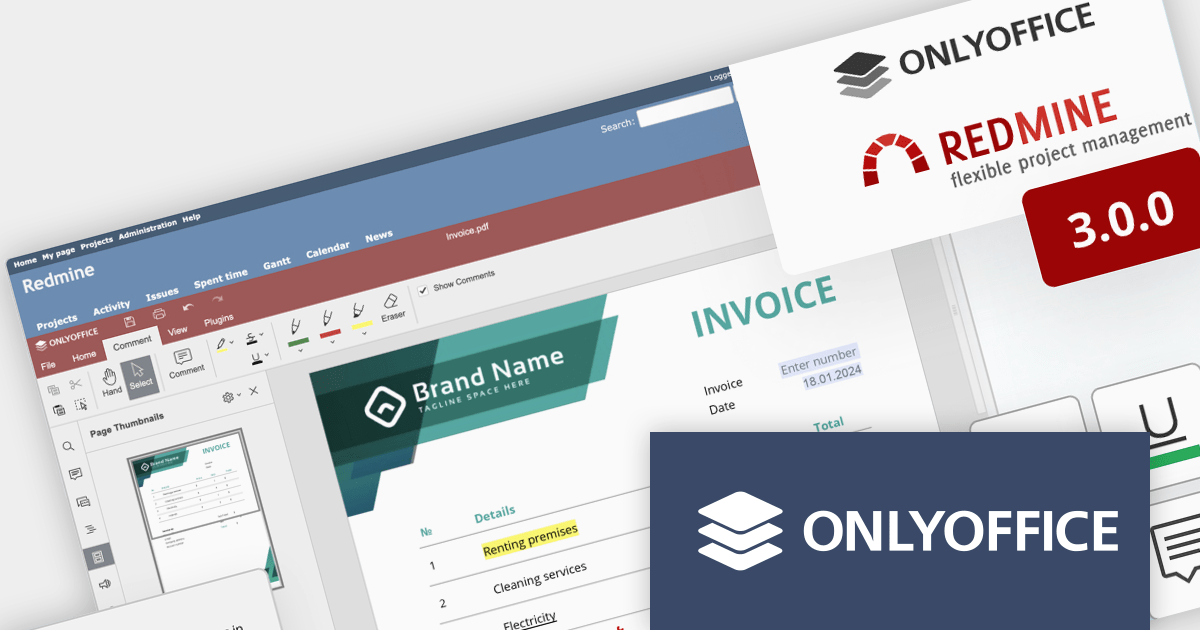
ONLYOFFICE Docs Enterprise Edition with Redmine Connector combines an online document editor with a seamless integration for Redmine, the Ruby on Rails-based project management hub. This allows teams to create, view, edit, and collaborate on spreadsheets, presentations, and text files online, directly within Redmine, boosting efficiency and eliminating the need for file switching.
ONLYOFFICE Redmine connector v3.0.0 expands the list of file formats that are available for editing. Previous releases supported DOCX, XLSX, PPTX, DOCXF and OFORM, but the latest update allows you to use ONLYOFFICE Docs directly within Redmine, to edit DOCM, DOTM, DOTX, XLSM, and XLTM files. The following formats may also be opened for editing by checking them in the format settings, though please note that data loss may occur due to format restrictions: EPUB, FB2, HTML, ODT, OTT, RTF, TXT, CSV, OTS, ODS, and ODP.
To see a full list of what's new in v7.5.1 (3.0.0), see our release notes.
ONLYOFFICE Docs Enterprise Edition with Redmine Connector is licensed per server and is available as an annual license with 1 year of support and updates, or as a perpetual license with 3 years of support and updates. See our ONLYOFFICE Redmine connector licensing page for full details.
For more information, see our ONLYOFFICE Redmine connector product page.
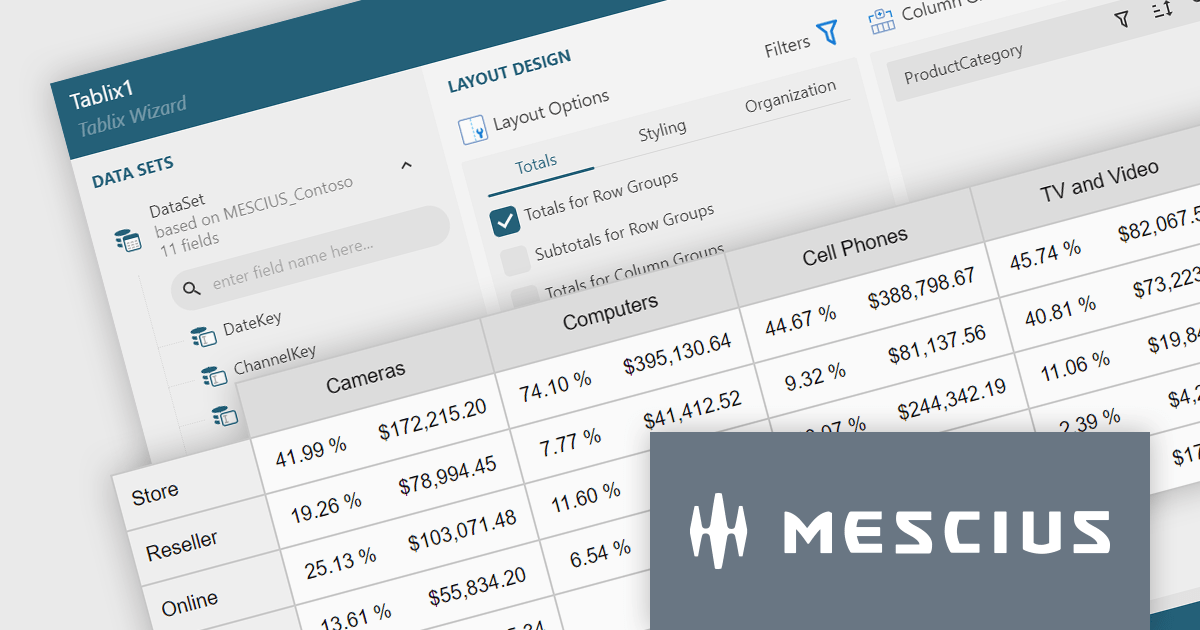
ActiveReportsJS is a reporting tool for web applications that allows developers and report authors to easily design and display reports within their applications. With a wide range of features, such as drill-down, runtime data filtering, and parameter-driven reports, as well as compatibility with popular frameworks, ActiveReportsJS simplifies the process of creating and managing reports.
A Tablix is a versatile report item that acts as a unified platform for displaying data in table, matrix (cross-tab), and list formats. It offers a flexible layout grid with nested rows and columns, allowing you to structure data for easy analysis and visualization. This empowers you to present detailed information, group data by categories, and summarize key metrics, all within a single report element.
In this blog, MESCIUS Technical Engagement Engineer Joel Parks shows you how to use ActiveReportsJS to add a Tablix control to your JavaScript report. Steps include:
Read the full blog and give your users the ability to create flexible reports with the ability to adapt to changing data conditions.
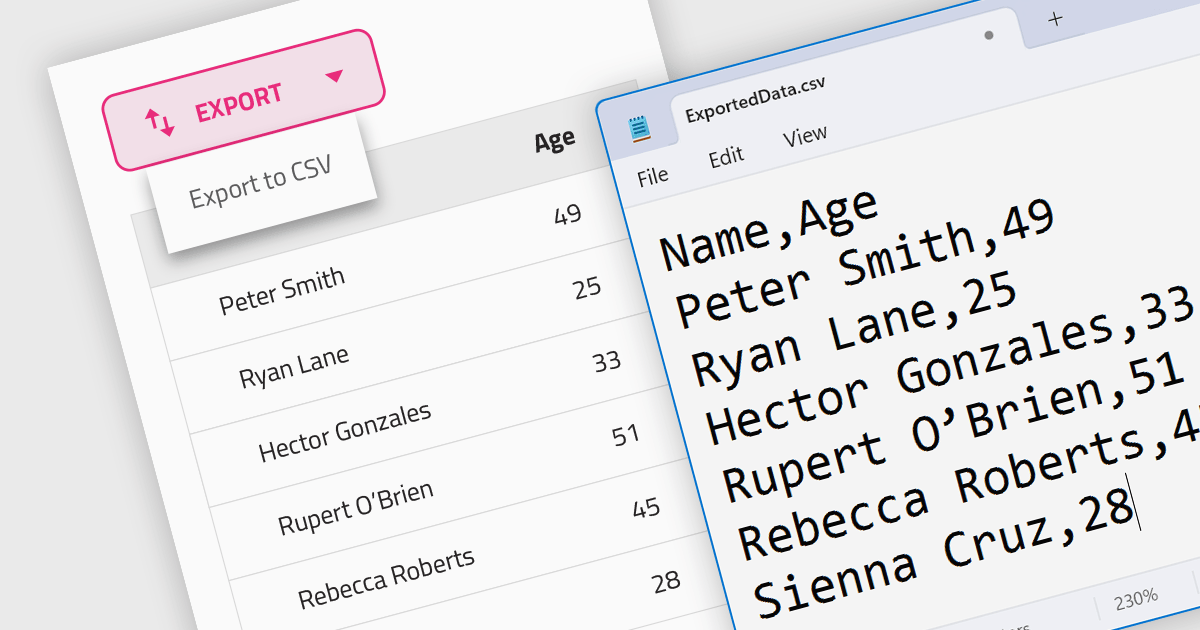
CSV export functionality in a grid control empowers users to seamlessly bridge the gap between interactive visualization and in-depth analysis. By exporting the displayed data as a readily importable CSV file, users gain immediate access to a familiar format compatible with diverse spreadsheet tools. This feature promotes efficient data extraction, facilitating further analysis, report generation, and data sharing, all directly from the convenience of the grid interface.
Several Angular grid controls support exporting to CSV, such as:
For an in-depth analysis of features and price, visit our Angular grid controls comparison.
Stimulsoft Dashboards is a versatile suite of tools for crafting interactive data visualizations for web and desktop applications. It empowers developers to embed intuitive dashboards across various platforms, including .NET, JavaScript, and PHP, using the platform-specific components or a centralized cloud designer. With rich data analysis elements, extensive customization options, and pre-built templates, Stimulsoft Dashboards helps you transform complex data into clear, actionable insights for any audience.
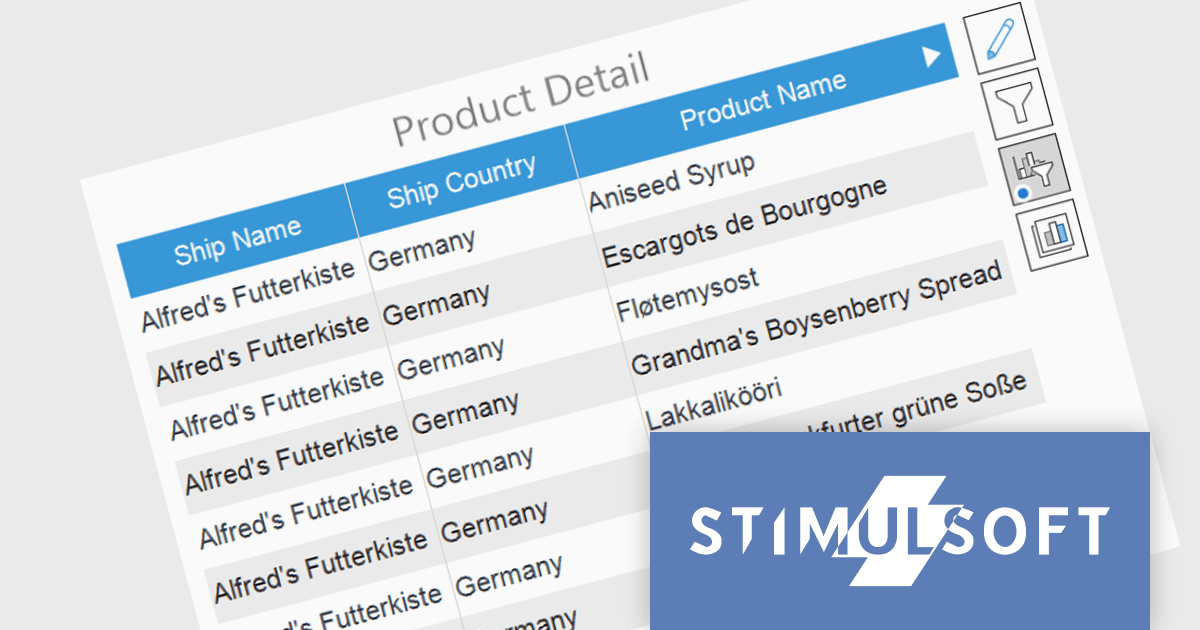
The Stimulsoft Dashboards 2024.1.1 update adds the option to include custom filters for the Table element in dashboards. When filters are applied to the table, a dedicated control element lets you easily edit and remove user filters with a single click. This intuitive addition streamlines workflow, keeps you focused, and ensures your dashboards always reflect the exact insights you need.
To see a full list of what's new in version 2024.1.1, see our release notes.
Stimulsoft Ultimate is licensed per developer and is available as a Perpetual license with 1 year support and maintenance. See our Stimulsoft Ultimate licensing page for full details.
Stimulsoft Dashboards is available to buy in the following products:
Tel: (888) 850 9911
Fax: +1 770 250 6199


