


Proveedor oficial
Como distribuidores oficiales y autorizados, le suministramos licencias legítimas directamente de más de 200 editores de software.
Ver todas nuestras marcas.
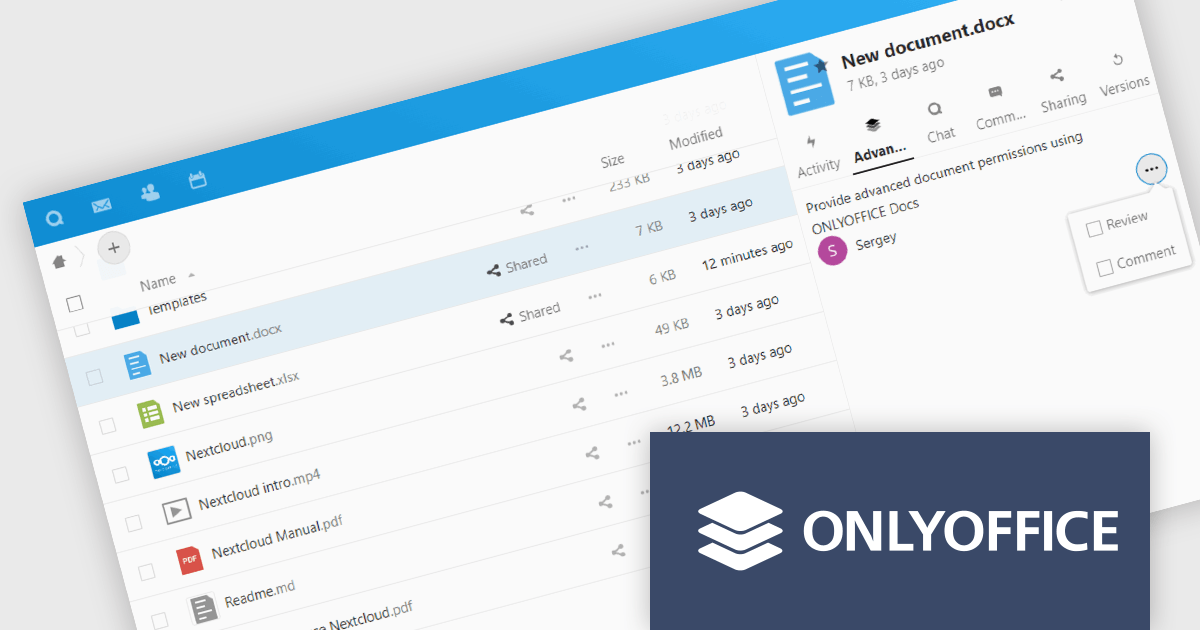
ONLYOFFICE Docs Enterprise Edition with Nextcloud Connector combines an online document editor with a seamless integration for Nextcloud, which is a open-source, on-premises content collaboration platform. This allows teams to create, view, edit, and collaborate on spreadsheets, presentations, and text files online, directly within Nextcloud, boosting efficiency and eliminating the need for file switching.
The ONLYOFFICE Nextcloud Connector v9.1 release (available as part of ONLYOFFICE Docs Enterprise Edition with Nextcloud Connector v8.0.1) brings enhanced security and granular control for developers working with public document sharing and Nextcloud Talk. Advanced access permissions for reviewing, commenting and custom filtering are now available for files with public access and for files created within the Nextcloud Talk app. These permissions ensure that external collaborators can contribute without compromising document integrity or security. It also promotes a more structured and controlled environment for real-time collaboration, ensuring that contributions are tracked and managed effectively according to the roles defined by the document owner.
To see a full list of what's new in ONLYOFFICE Docs Enterprise Edition v8.0.1 with Nextcloud Connector v9.1, see our release notes.
ONLYOFFICE Docs Enterprise Edition with Nextcloud Connector is licensed per server and is available as an annual license with 1 year of support and updates, or as a perpetual license with 3 years of support and updates. See our ONLYOFFICE Nextcloud connector licensing page for full details.
For more information, see our ONLYOFFICE Nextcloud connector product page.
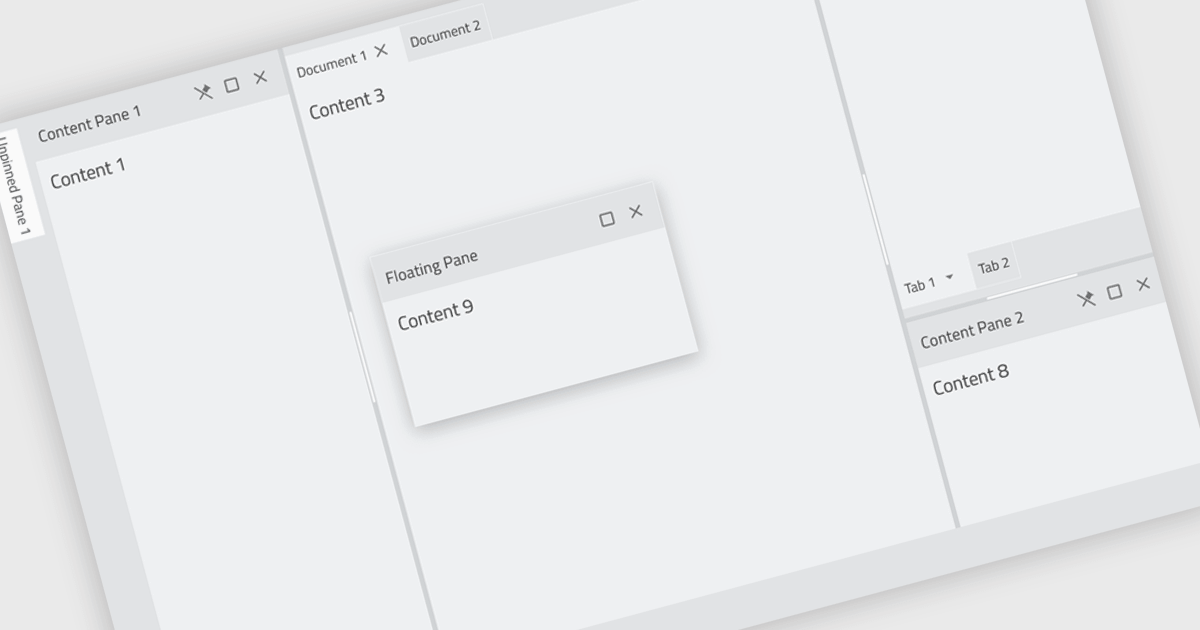
Docking controls are a user interface element that allows users to organize and customize the layout of an application's windows. These controls typically function by enabling users to drag-and-drop windows or panes to different positions on the screen, or to attach them to the edges of the main application window. This functionality provides several benefits, including increased efficiency by allowing users to arrange windows in a way that suits their workflow, improved organization by keeping relevant windows grouped together, and better screen real estate utilization by enabling users to resize and position windows for optimal viewing.
Several React UI suites feature a docking component including:
For an in-depth analysis of features and price, visit our React UI Suites comparison.
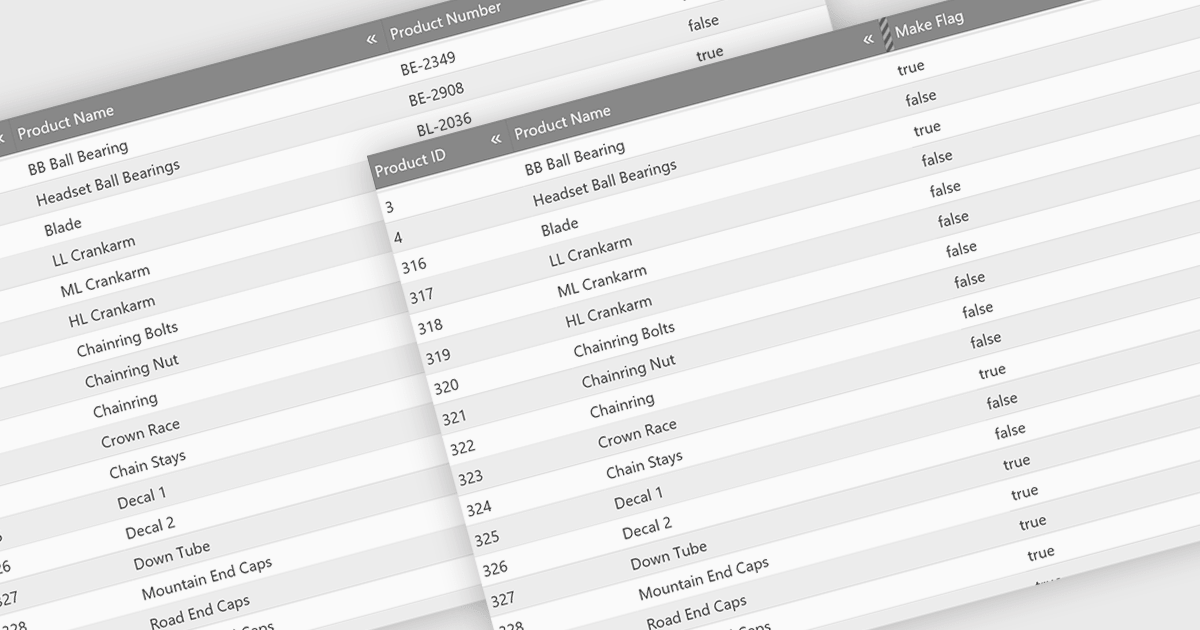
Hiding columns in a grid allows for a more focused data display by selectively removing irrelevant or less important information from the user's view. This functionality improves data clarity, particularly for grids with a large number of columns. By hiding specific columns, users can concentrate on the most important data points, reducing clutter and improving overall user experience.
Several jQuery Grid controls offer the ability to hide columns including:
For an in-depth analysis of features and price, visit our jQuery Grid controls comparison.

ONLYOFFICE Docs Enterprise Edition with ownCloud Connector combines an online document editor with seamless integration for ownCloud, a real-time content collaboration platform. This allows teams to create, view, edit, and collaborate on spreadsheets, presentations, and text files directly within ownCloud, boosting efficiency and eliminating the need for file switching.
The ONLYOFFICE ownCloud Connector v9.1.1 release (available as part of ONLYOFFICE Docs Enterprise Edition with ownCloud Connector v8.0.1) introduces the ability to specify which users can access certain protected ranges, enhancing the granularity of permissions management within documents. By allowing administrators to define access at a more detailed level, it ensures that only designated users can view or modify specific parts of a document. This not only bolsters security by minimizing the risk of unauthorized access but also aids in compliance with stringent data protection standards. For developers, it simplifies the task of integrating advanced security measures into applications, providing a robust framework for managing document access in a collaborative setting.
To see a full list of what's new in ONLYOFFICE Docs Enterprise Edition v8.0.1 with ownCloud Connector v9.1.1, see our release notes.
ONLYOFFICE Docs Enterprise Edition with ownCloud Connector is licensed per server and is available as an annual license with 1 year of support and updates, or as a perpetual license with 3 years of support and updates. See our ONLYOFFICE ownCloud connector licensing page for full details.
For more information, see our ONLYOFFICE ownCloud connector product page.
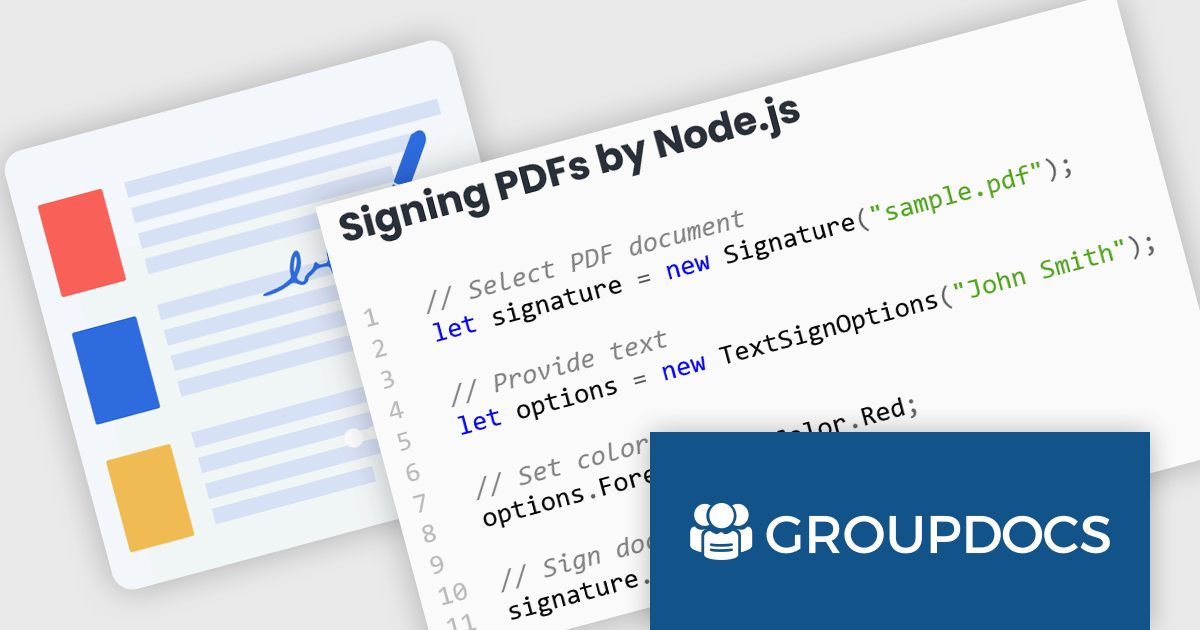
GroupDocs.Signature for Node.js via Java offers a solution for developers working with Node.js applications who require document signing functionalities. It bridges the gap between these two environments by enabling the use of GroupDocs.Signature's robust Java library within Node.js projects. This integration empowers developers to seamlessly add features like digital signatures, text annotations, image stamps, and QR codes to various document formats directly within their Node.js applications.
This approach unlocks a multitude of benefits. Developers can leverage the extensive document processing capabilities of GroupDocs.Signature without needing Java expertise within their Node.js codebase. The solution streamlines the development process, eliminates the need for maintaining separate code for different languages, and simplifies the integration of signing functionalities into existing Node.js applications. This makes GroupDocs.Signature for Node.js via Java ideal for scenarios like e-document signing workflows, contract management platforms, and any Node.js application requiring a user-friendly and secure document signing experience.
GroupDocs.Signature for Node.js via Java is offered as Developer Small Business, Developer OEM, Site Small Business, and Site OEM licenses catering to a range of business needs. Licenses are perpetual, and include 1 year of support and maintenance. Subscription renewals are also available. See our GroupDocs.Signature for Node.js via Java licensing page for full details.
GroupDocs.Signature for Node.js via Java is available in the following products:
Tel: (888) 850 9911
Fax: +1 770 250 6199


