


Proveedor oficial
Como distribuidores oficiales y autorizados, le suministramos licencias legítimas directamente de más de 200 editores de software.
Ver todas nuestras marcas.
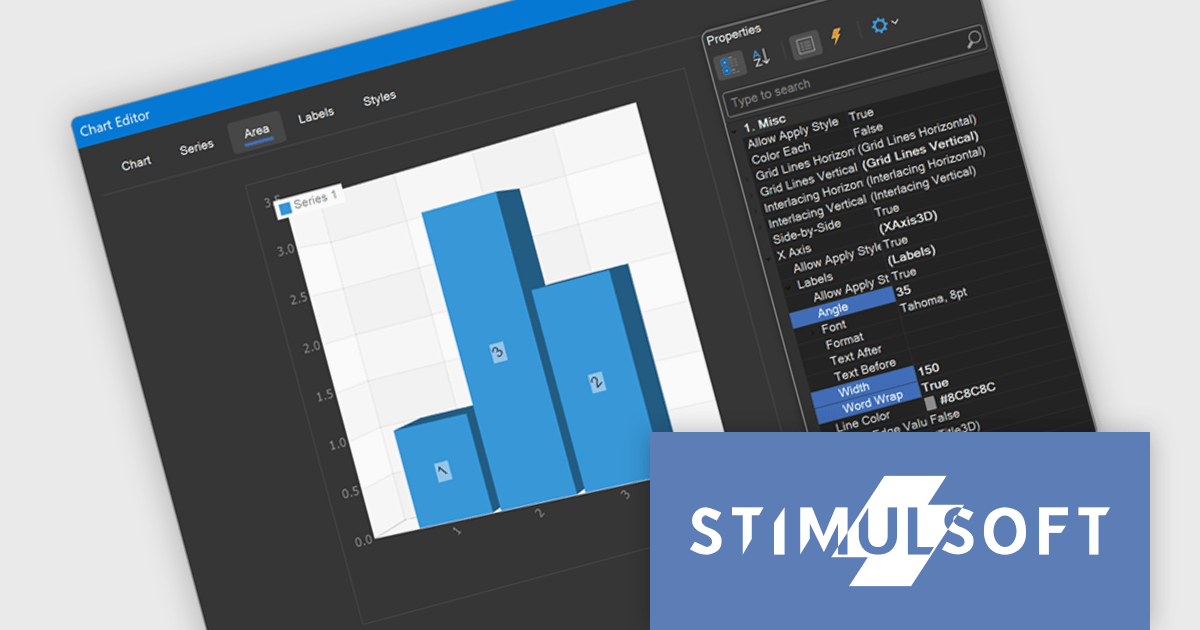
Stimulsoft Dashboards.PYTHON is a data visualization tool specifically designed for building interactive dashboards within Python applications. It combines a client-side JavaScript engine for data processing with a designer component to craft dashboards and a viewer for displaying them. This empowers developers to create clear and informative visual representations of data directly within their Python projects.
The Stimulsoft Dashboards.PYTHON 2025.3.1 update enhances 3D chart usability by introducing new axis label settings that improve how labels are displayed in complex data visualizations. Developers can now rotate labels to align with chart angles, define a maximum width to prevent overlap, and enable word wrap to maintain readability in constrained spaces. These additions provide greater control over chart formatting, allowing for clearer presentation of axis data, especially in dashboards with dense or multilingual content.
To see a full list of what's new in 2025.3.1, see our release notes.
Stimulsoft Dashboards.PYTHON is licensed per developer and is available as a perpetual license with 1 year support and maintenance. See our Stimulsoft Dashboards.PYTHON licensing page for full details.
Stimulsoft Dashboards.PYTHON is available individually or as part of Stimulsoft Ultimate.
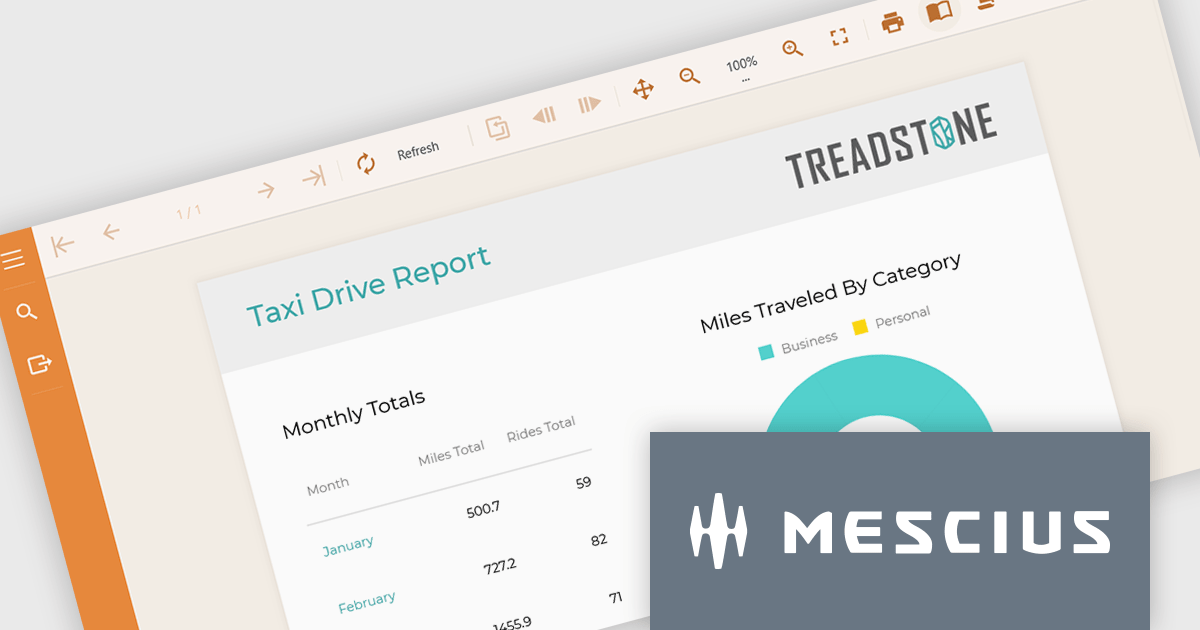
ActiveReportsJS is a powerful, lightweight reporting tool designed to seamlessly integrate advanced reporting capabilities into any JavaScript application. ActiveReportsJS enables developers to create, view, export, and print richly formatted reports entirely on the client side - with zero server dependencies.
On July 24, 2025 at 11:00 AM EDT, MESCIUS (formerly GrapeCity) will be presenting a CodeClinic Live Webinar to demonstrate how you can include the ActiveReportsJS Report Viewer and Report Designer in your application. From implementing the controls to a step-by-step process on how to build reports, by the end, you'll have all of the tools needed to incorporate an advanced reporting solution in your web applications.
Register for the LIVE webinar today, and mark your calendar for July 24.
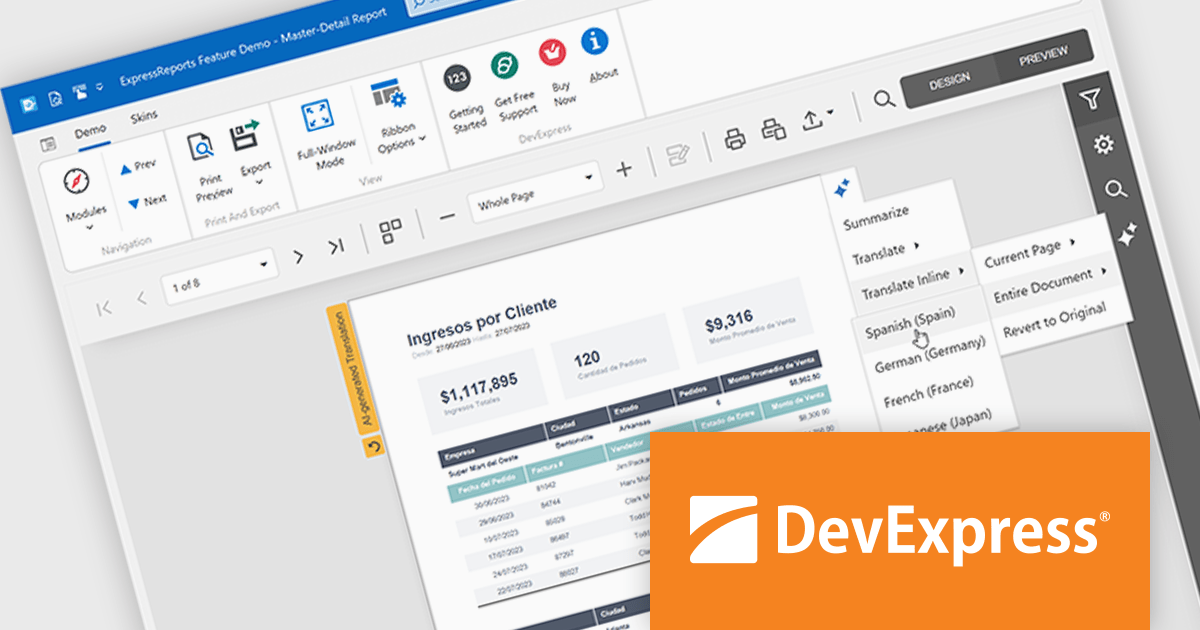
DevExpress (Developer Express) is an award-winning software development company based in the United States. It produces coding assistance tools and components for Delphi, C++ Builder and Microsoft Visual Studio developers. The major part of its product line is VCL, .NET WinForms and ASP.NET components that replicate the UI of Microsoft Windows and Microsoft Office applications.
With the recent release of version 25.1, the entire DevExpress product line has undergone significant changes:
This powerful new functionality comes at a higher price. DevExpress has implemented price raises across all product lines for both new licenses and renewals. To view all of the current, updated prices, see the comprehensive product list on the DevExpress Brand Page.
**Note: If you have a current, valid quote from ComponentSource at the previous pricing, the price will be honored up to that quote's expiration date.
The DevExpress VCL Subscription + (DevExpress VCL Subscription Plus) includes:
DevExpress Reporting is available to buy in the following products:
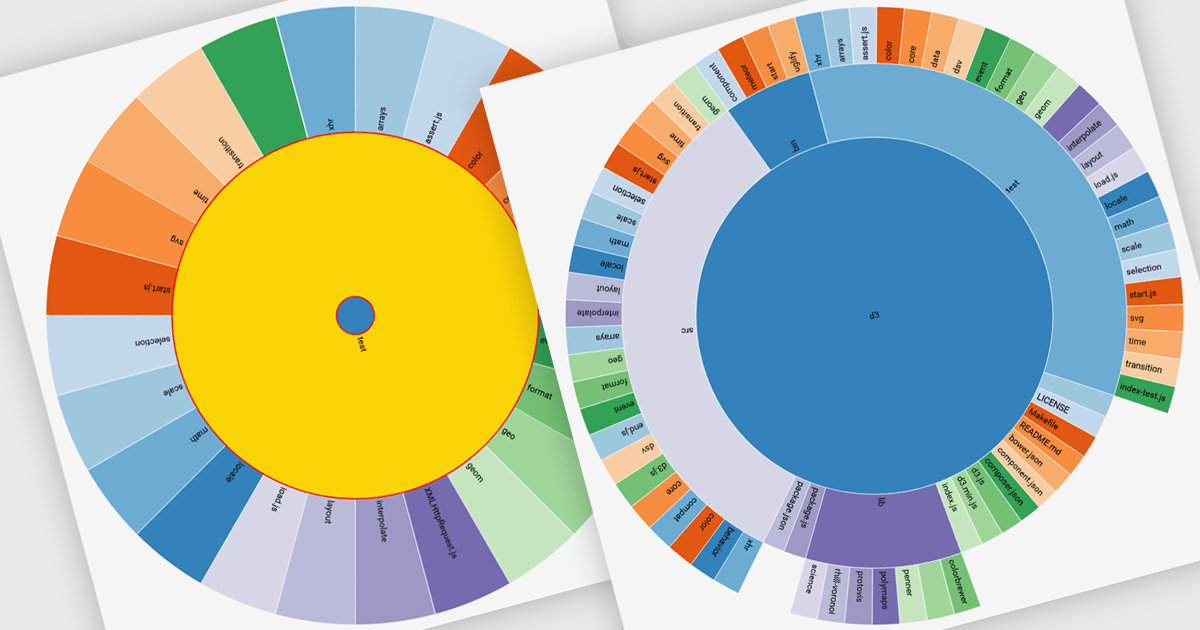
Radial charts are circular data visualizations used to represent hierarchical, proportional, or cyclical data. A key type is the sunburst chart, which displays multi-level hierarchies using concentric rings, where each ring represents a level and each segment shows a category or subcategory. This format helps users quickly grasp both structure and proportion. Sunburst charts are ideal for exploring complex data in a compact space and are commonly used for visualizing organizational charts, file systems, website structures, and product categories. Their interactive format allows users to drill into data for deeper insight without losing context.
Several JavaScript charting components provide you with radial charts, including:
For an in-depth analysis of features and price, visit our JavaScript chart components comparison.
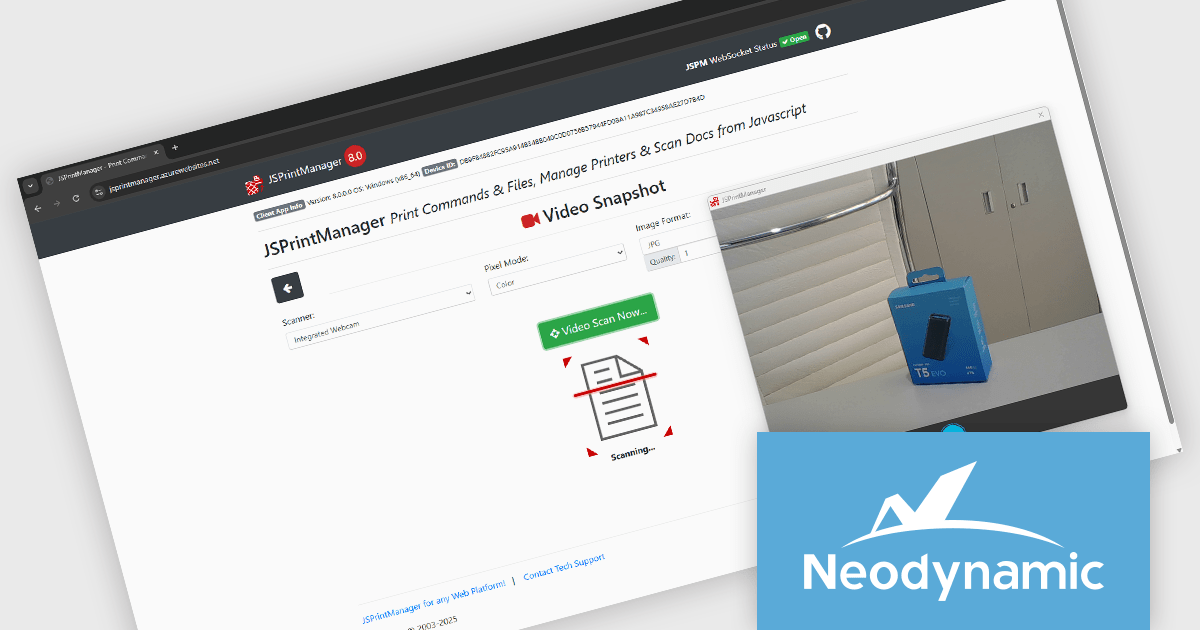
Neodynamic offers two JSPrintManager solutions for client-side printing and scanning in web applications. JSPrintManager for Any Web Platform allows you to integrate printing functionality into any website built with technologies like ASP.NET, PHP, or Blazor using pure JavaScript. Neodynamic also offers JSPrintManager for Blazor which enables you to seamlessly add printing capabilities to your Blazor server or WebAssembly projects with C# code. Both solutions empower you to print various data formats directly from the browser without requiring user interaction with print dialogs.
The Neodynamic JSPrintManager 8.0 releases add the ability for the Windows Client to take a video snapshot through any video device available on the client PC. This means, for example, that a camera can be used as a scanner to take a snapshot/picture. This is particularly useful in contexts where quick documentation is needed, such as capturing IDs, receipts, or physical documents, without needing a separate scanning application. It reduces reliance on traditional scanners and broadens the type of input devices that can integrate with browser-based printing operations.
To see a full list of what's new in 8.0, see our release notes for JSPrintManager for Any Web Platform and JSPrintManager for Blazor.
Neodynamic JSPrintManager is licensed per Web App and Web server and is available as a Perpetual license which includes 1 year of free updates and priority support. See our Neodynamic JSPrintManager for Any Web Platform and Neodynamic JSPrintManager for Blazor licensing pages for full details.
Learn more on our Neodynamic JSPrintManager for Any Web Platform and Neodynamic JSPrintManager for Blazor product pages.
Tel: (888) 850 9911
Fax: +1 770 250 6199


