













Proveedor oficial
Como distribuidores oficiales y autorizados, le suministramos licencias legítimas directamente de más de 200 editores de software.
Ver todas nuestras marcas.
Stimulsoft Reports.JS provides a robust reporting toolkit designed specifically for JavaScript applications. This library leverages a client-side architecture, offering a pure JavaScript report engine for efficient report rendering directly within web browsers. The solution includes a user-friendly report designer for building reports with various data sources and visualizations, along with a report viewer for seamless integration and display within your JavaScript applications. This eliminates the need for server-side dependencies or browser plugins, simplifying the development process for embedding powerful reporting functionalities into your web projects.
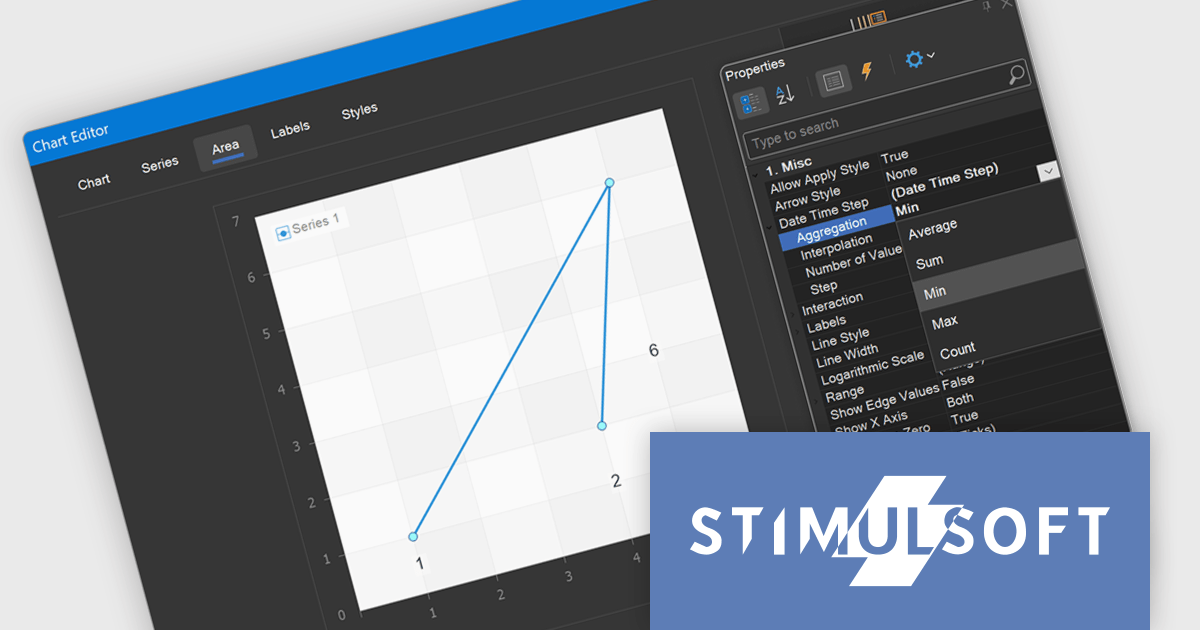
Stimulsoft Reports.JS now supports aggregation for Date Time Step, allowing developers to select from multiple data aggregation functions including Average, Sum, Min, Max, and Count. This enhancement provides greater control over how time-based data is grouped and displayed in report charts, enabling more accurate and relevant visualizations based on the specific nature of the dataset. By choosing the appropriate aggregation method, developers can optimize performance reporting, reveal insights more effectively, and better align visual outputs with analytical requirements.
Stimulsoft Reports.JS is licensed per developer and is available as a Perpetual license with 1 year support and maintenance. See our Stimulsoft Reports.JS licensing page for full details.
Stimulsoft Reports.JS is available individually or as part of Stimulsoft Ultimate.
DevExtreme Complete is a robust suite of tools by DevExpress designed to streamline the development of high-performance web applications. It includes a wide range of UI components for modern frameworks such as Angular, React, Vue, and jQuery, making it ideal for developers aiming to create responsive, cross-platform applications with ease. With features like rich data visualization, interactive grids, form controls, and adaptive layouts, it empowers developers to deliver polished and user-friendly interfaces. Whether you're building enterprise dashboards or consumer-facing apps, DevExtreme Complete provides the flexibility and power to meet complex requirements while maintaining performance and usability.
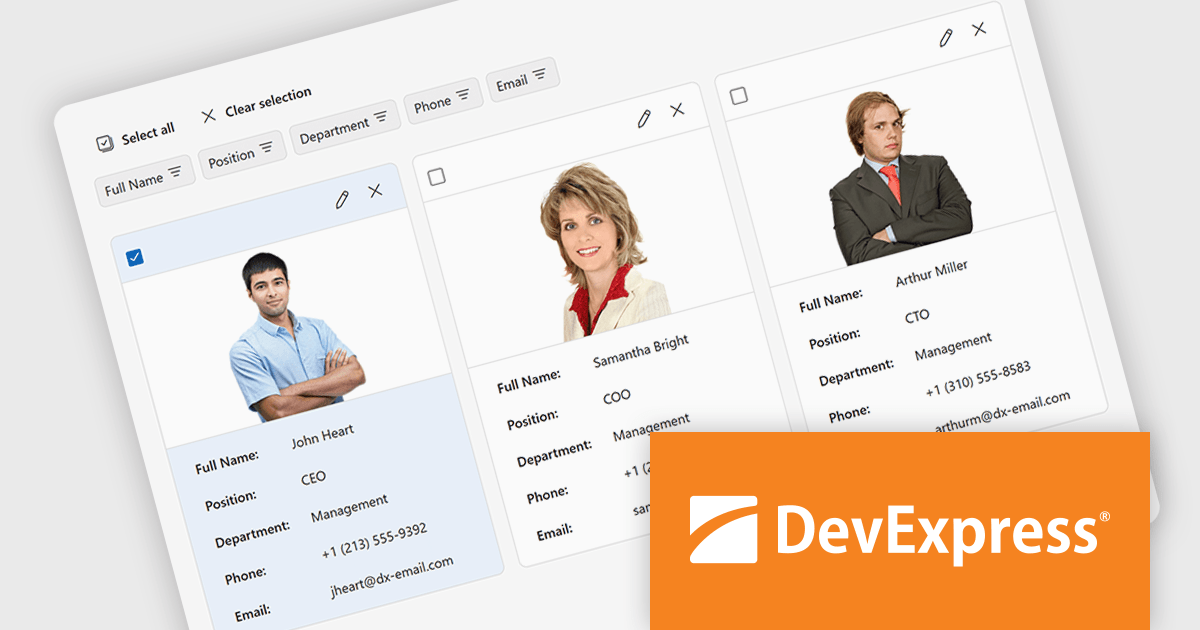
The DevExtreme Complete v25.1 release adds a new CardView component, which presents data in a card-based layout instead of the traditional grid format. It’s particularly suited to use cases like employee directories, contact lists, product catalogs, and task boards - any scenario where visual content such as images plays a central role. Each card includes a toolbar, cover image, main content area, and footer, all of which can be modified using the component's public API. This gives developers the flexibility to adapt the layout and behavior of CardView to meet specific application requirements.
To see a full list of what's new in version v25.1, see our release notes.
DevExtreme Complete is licensed per developer and is available as a Perpetual License with a 12 month support and maintenance subscription. See our DevExtreme Complete licensing page for full details.
DevExtreme Complete is available to buy individually or as part of the following products:
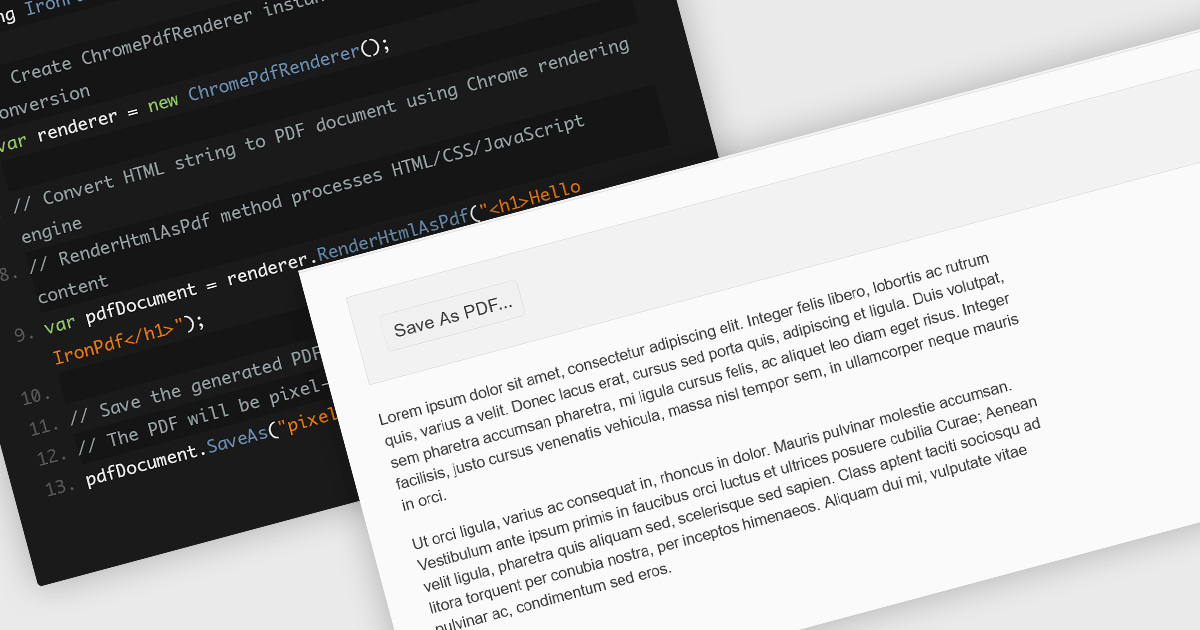
Converting HTML files to PDF within PDF component libraries offers an easy way to capture richly styled, web-based content in a fixed, shareable format. This feature typically uses a browser-like rendering engine to accurately represent CSS, images, fonts, and links, ensuring that what you see in the browser is preserved in the document. It's especially useful for generating reports, invoices, documentation, and static snapshots of dynamic web pages, combining familiarity of web-based layout with the portability and consistency of PDFs.
Several JavaScript PDF controls offer HTML fo PDF conversion including:
For an in-depth analysis of features and price, visit our JavaScript PDF controls comparison.
List & Label by combit is a software development toolkit that empowers developers to integrate comprehensive reporting functionalities into their desktop, web, and cloud applications. It offers features such as data binding, complex data visualization, and a user-friendly report designer, along with printing, exporting, and previewing capabilities. List & Label operates independently of programming languages and data sources, providing developers with the flexibility to design and deliver informative reports within their development environment.
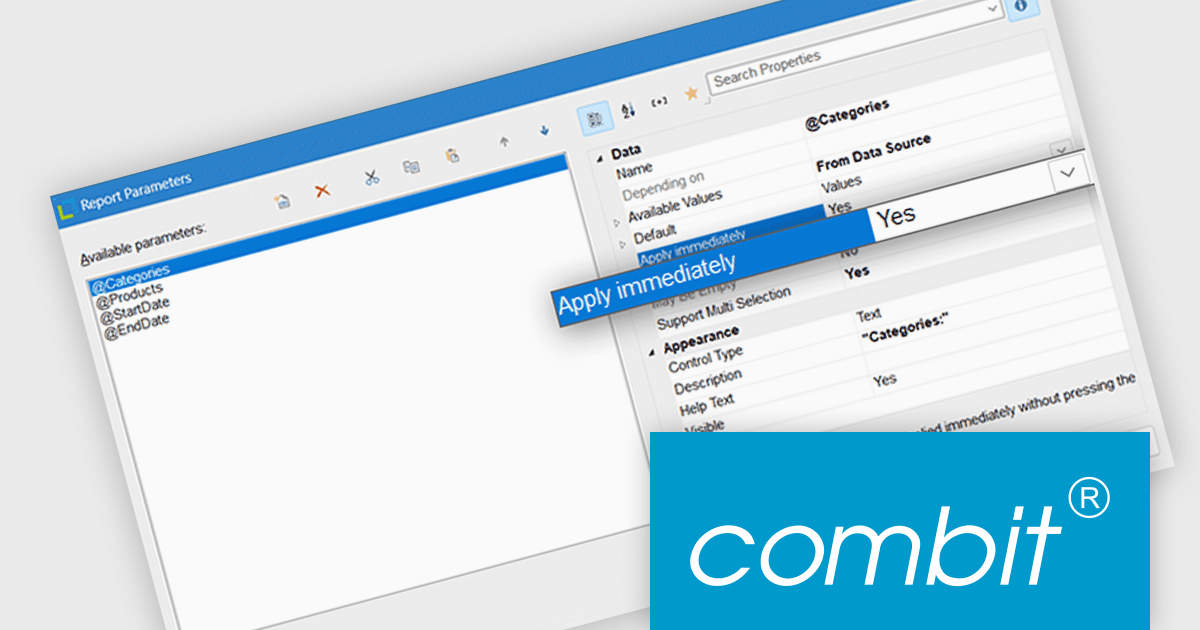
List & Label now includes an "Apply immediately" property for report parameters, which when set, automatically re-renders the report immediately after the property in question is changed. This feature removes the need to manually refresh the report when updating the parameters, making it particularly useful in interactive reporting scenarios where users need to see updated results as they adjust filters or settings in real time.
List & Label is licensed per developer and is available as a Perpetual License with a 12 month support and maintenance subscription. See our List & Label licensing page for full details.
List & Label is available in the following products:
Stimulsoft Dashboards.PYTHON is a data visualization tool specifically designed for building interactive dashboards within Python applications. It combines a client-side JavaScript engine for data processing with a designer component to craft dashboards and a viewer for displaying them. This empowers developers to create clear and informative visual representations of data directly within their Python projects.
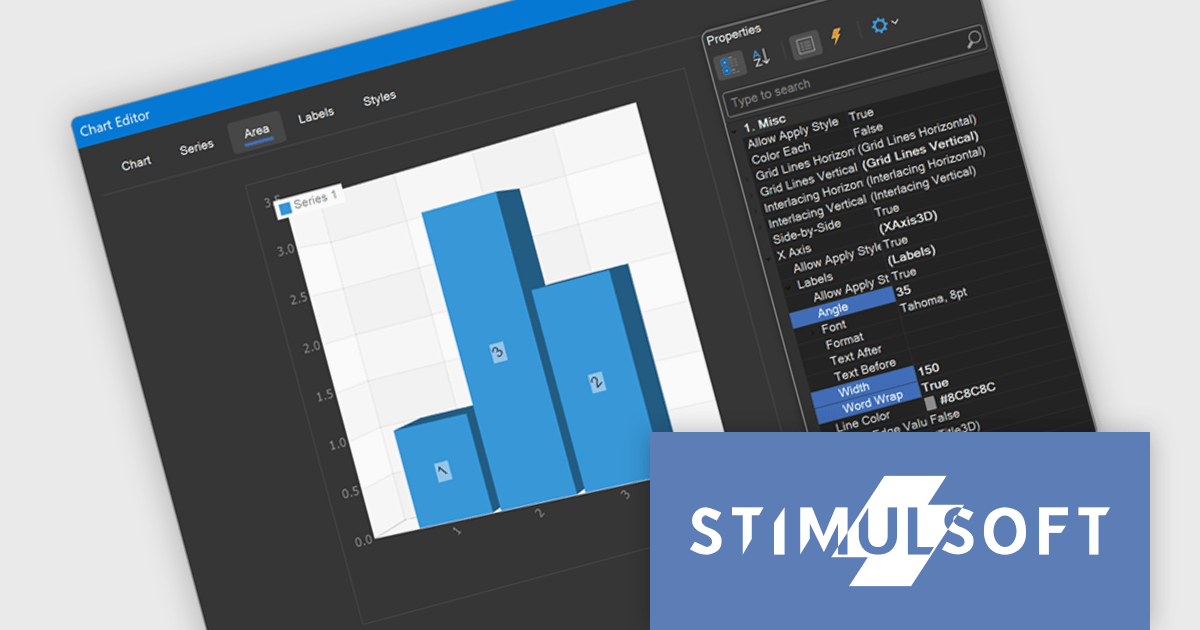
The Stimulsoft Dashboards.PYTHON 2025.3.1 update enhances 3D chart usability by introducing new axis label settings that improve how labels are displayed in complex data visualizations. Developers can now rotate labels to align with chart angles, define a maximum width to prevent overlap, and enable word wrap to maintain readability in constrained spaces. These additions provide greater control over chart formatting, allowing for clearer presentation of axis data, especially in dashboards with dense or multilingual content.
To see a full list of what's new in 2025.3.1, see our release notes.
Stimulsoft Dashboards.PYTHON is licensed per developer and is available as a perpetual license with 1 year support and maintenance. See our Stimulsoft Dashboards.PYTHON licensing page for full details.
Stimulsoft Dashboards.PYTHON is available individually or as part of Stimulsoft Ultimate.
Tel: (888) 850 9911
Fax: +1 770 250 6199


