













Proveedor oficial
Como distribuidores oficiales y autorizados, le suministramos licencias legítimas directamente de más de 200 editores de software.
Ver todas nuestras marcas.
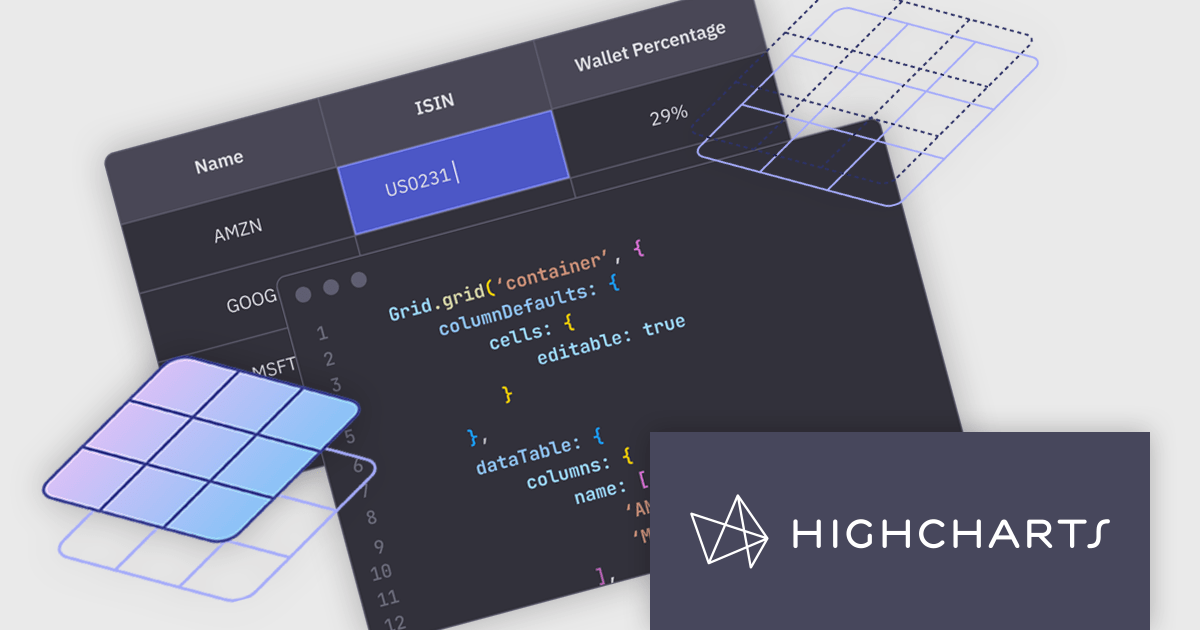
Highcharts Grid is a feature-rich data grid component developed by Highsoft, designed for use within Highcharts Dashboards or as a standalone component. Grid Lite is a free, lightweight version ideal for developers seeking a performant and accessible data grid with a basic feature set. Grid Pro is a commercial, feature-rich version built for complex applications that demand advanced data manipulation and interactivity. It includes all the capabilities of Grid Lite, along with a highly customizable and interactive interface that supports inline editing, column sorting, and event handling, enabling developers to build responsive data visualization applications.
Highcharts Grid delivers high performance when handling large datasets by employing row virtualization, a technique that renders only the rows currently visible within the viewport. This significantly reduces memory consumption and ensures fluid, responsive scrolling, even when working with thousands of records.
Highcharts Grid Pro requires a license for Highcharts Dashboards, licensed per developer as an Annual or Perpetual License with Internal, Saas, SaaS+ and OEM distribution options. The annual license includes support and all product updates for 1 year and must be renewed to continue to use the software. The perpetual license includes an "Advantage Subscription" for 1 to 5 years which provides support and updates for that period. If you do not renew Advantage then you may continue to use the software at the last release available during the active Advantage period. See our Highcharts Dashboards licensing page for full details.
Learn more on our Highcharts Dashboards product page.
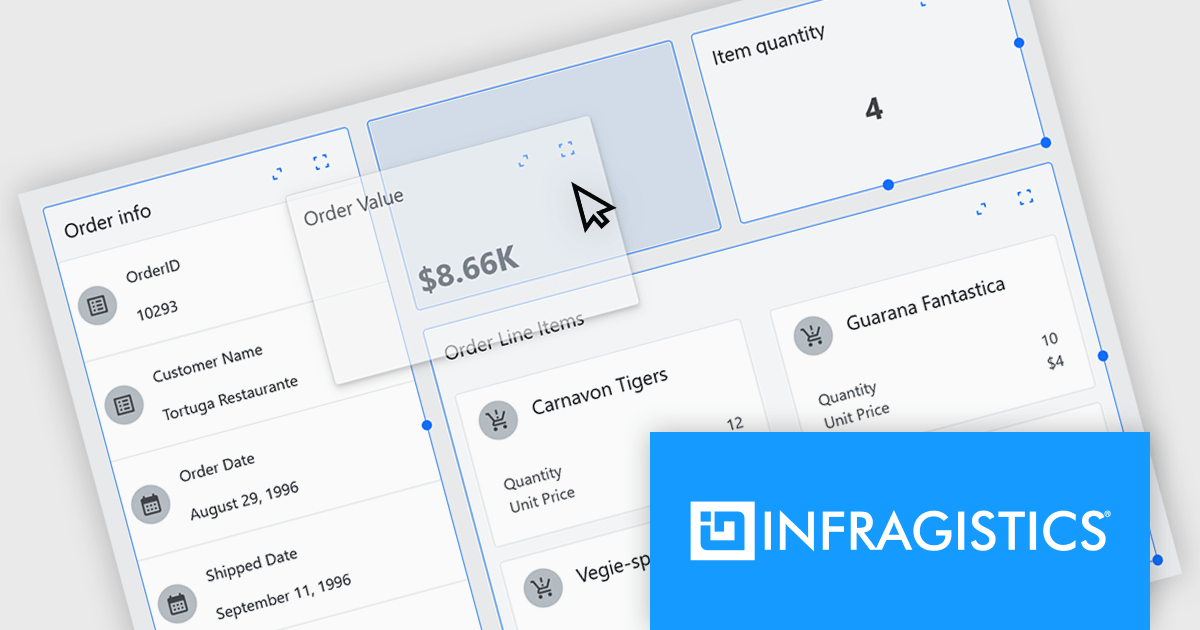
Infragistics Ignite UI for Web Components is a comprehensive library of pre-built, reusable UI components designed for constructing modern web applications using the Web Components standard. It offers a diverse collection of data grids, charts, and interactive elements, enabling developers to rapidly create high-performance, cross-platform applications without dependency complexities.
The Ignite UI for Web Components 5.3 update introduces a new Tile Manager component. This new feature lets users organize content into individual tiles that can be resized and rearranged on the fly. By enabling real-time layout customization, it supports more efficient content management and a tailored user experience. This kind of flexibility is especially useful in dashboard scenarios, where users benefit from controlling how and where information is displayed.
To see a full list of what's new in version 5.3, see our release notes.
Infragistics Ignite UI for Web Components is part of Infragistics Ignite UI which is licensed per developer and is available as a Perpetual License with a 1, 2 or 3 year support and maintenance subscription. See our Infragistics Ignite UI licensing page for full details.
Ignite UI for Web Components is available to buy in the following products:
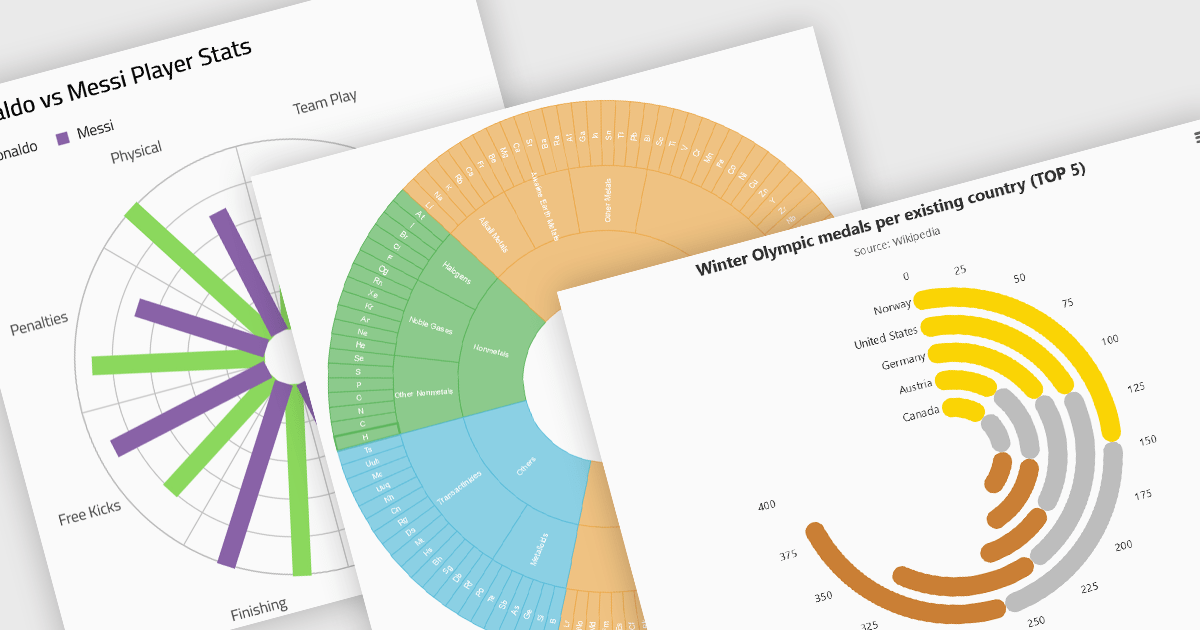
Radial charts provide an intuitive way to visualize hierarchical and categorical data. They display bars on a polar coordinate system instead of a cartesian system, which uses an x-y grid for positioning data. These charts represent values in a circular layout, making it ideal for comparing proportions and relationships between data points. Circular bar charts, a variation of the traditional bar chart, arrange data in a radial format for displaying comparisons between categories. They are particularly useful for visualizing periodic or cyclical data, such as time-based metrics. Sunburst charts break down hierarchical structures into concentric rings. The center of the chart typically represents the root category, while outer rings depict subcategories. These are used for visualizing part-to-whole relationships within a dataset.
Several React chart controls offer radial charts including:
For an in-depth analysis of features and price, visit our React chart controls comparison.
Stimulsoft Reports.JS provides a robust reporting toolkit designed specifically for JavaScript applications. This library leverages a client-side architecture, offering a pure JavaScript report engine for efficient report rendering directly within web browsers. The solution includes a user-friendly report designer for building reports with various data sources and visualizations, along with a report viewer for seamless integration and display within your JavaScript applications. This eliminates the need for server-side dependencies or browser plugins, simplifying the development process for embedding powerful reporting functionalities into your web projects.
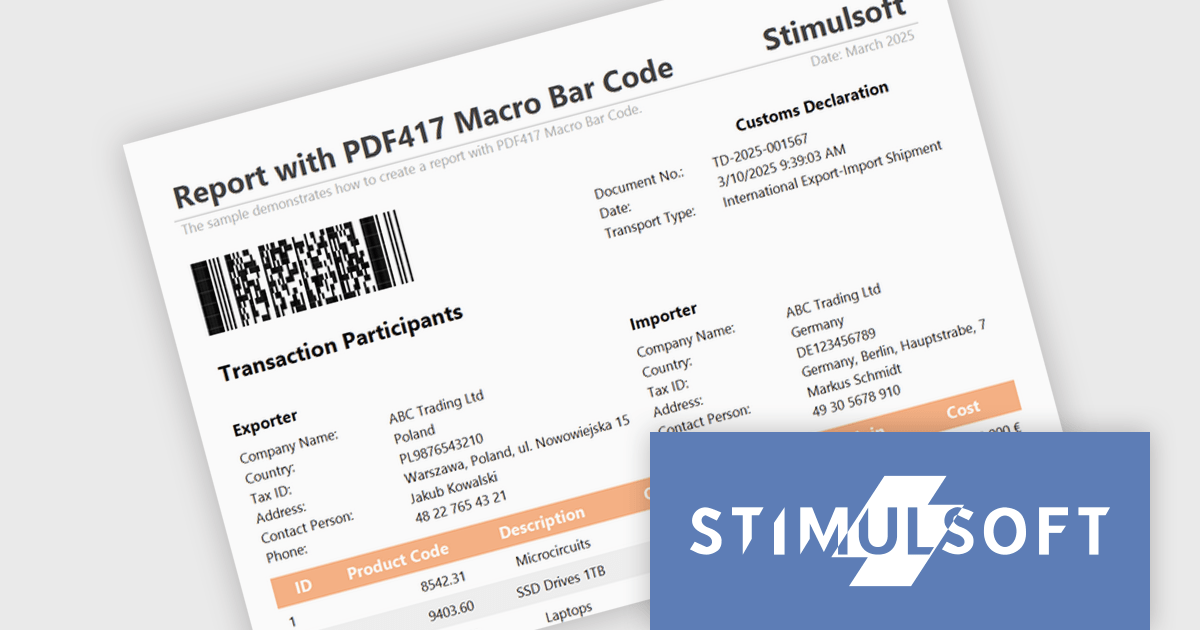
The Stimulsoft Reports.JS 2025.2.1 update introduces support for the Macro PDF417 barcode, allowing developers to handle larger data payloads within reports. Unlike the standard PDF417 barcode, which is limited in data capacity, the Macro PDF417 format enables the encoding of large data files by splitting them into multiple linked symbols. This enhancement is particularly useful when working with high-volume or multi-page reports, providing a reliable solution for encoding structured data without compromising layout or readability.
To see a full list of what's new in 2025.2.1, see our release notes.
Stimulsoft Reports.JS is licensed per developer and is available as a Perpetual license with 1 year support and maintenance. See our Stimulsoft Reports.JS licensing page for full details.
Stimulsoft Reports.JS is available individually or as part of Stimulsoft Ultimate.
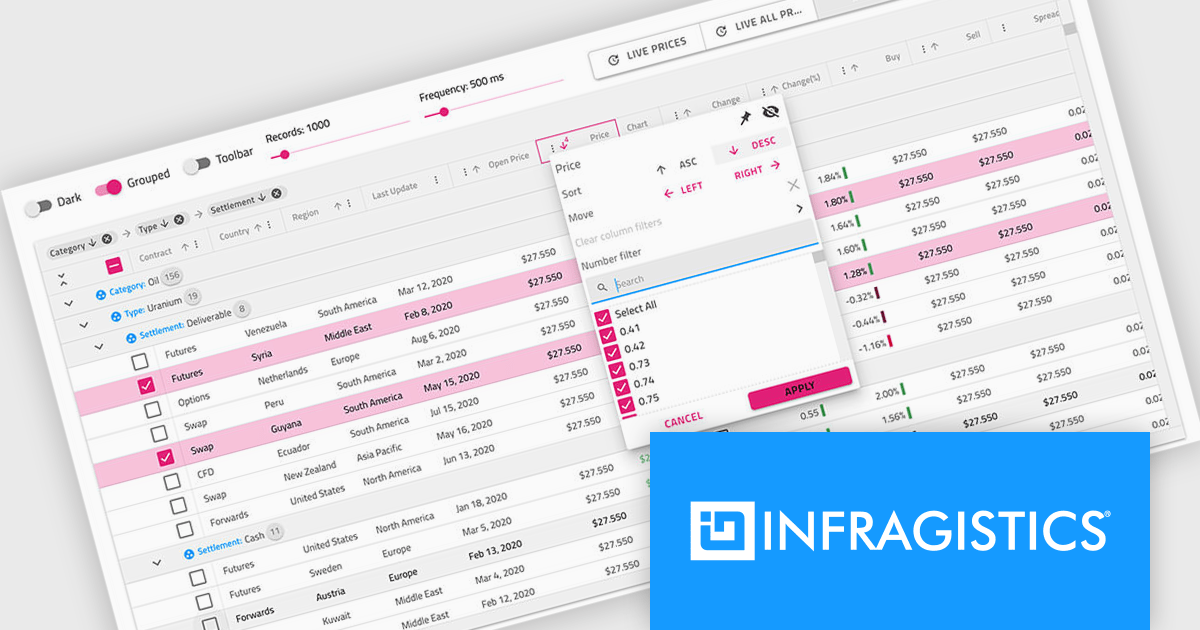
Infragistics Professional is a comprehensive toolkit for software developers, offering a wide range of pre-built, high-performance UI components for building visually appealing and feature-rich applications across Angular, React, Web Components, Blazor, ASP.NET MVC, ASP.NET Core, Windows Forms, WPF and Xamarin. It includes controls such as data grids, charts, navigation menus, and more, along with productivity tools to streamline development processes.
Infragistics Professional delivers a powerful Angular Data Grid Component that enables developers to efficiently display, manage, and interact with large datasets in modern web applications. Designed for performance and scalability, it offers advanced features such as editing, sorting, filtering, and data export, all seamlessly integrated into the Angular framework. This allows developers to build responsive, real-time data experiences that meet the demands of enterprise-grade applications.
Infragistics Professional is licensed per developer and is available as a Perpetual License with a 1, 2 or 3 year support and maintenance subscription. See our Infragistics Professional licensing page for full details.
The Ignite UI for Angular Data Grid is available in the following products:
Tel: (888) 850 9911
Fax: +1 770 250 6199


