













Proveedor oficial
Como distribuidores oficiales y autorizados, le suministramos licencias legítimas directamente de más de 200 editores de software.
Ver todas nuestras marcas.
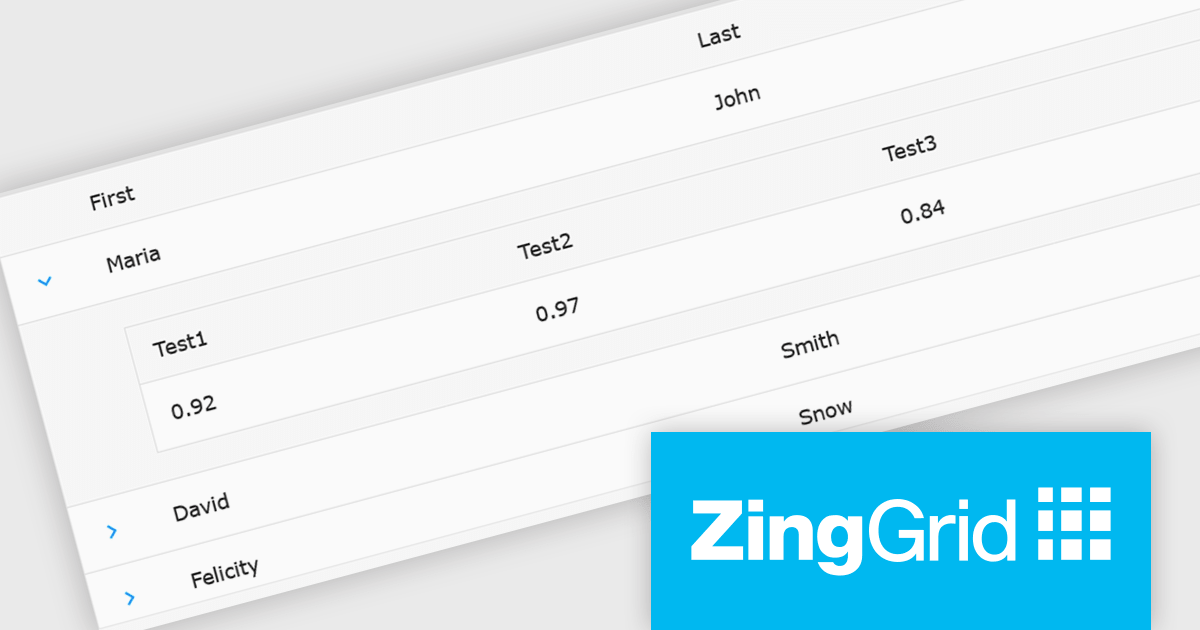
ZingGrid is a JavaScript library that simplifies the creation of interactive data tables and grids within web applications. Utilizing modern web components and focusing on performance and responsiveness, ZingGrid allows developers to implement features like searching, filtering, pagination, and in-line editing with minimal coding. This empowers efficient data visualization and manipulation for users, making it a valuable tool for web development.
The ZingGrid 2.0.0 release adds new Row Details feature that enhances data presentation by allowing users to expand individual rows and reveal supplementary information. This functionality provides a clean and organized way to display additional data without cluttering the main grid view. Whether you are editing, filtering, searching, or sorting your data, the expanded/collapsed state of each row is intelligently preserved, even across pages. This allows users to maintain context and easily access detailed information without losing their place or having to re-expand rows after interacting with other grid functionalities.
To see a full list of what's new in version 2.0.0, see our release notes.
ZingGrid is available as either a Single-Domain Website or Multi-Domain SaaS license. See our ZingGrid licensing page for full details.
For more information, visit our ZingGrid product page.

Aspose.Words for Node.js via .NET is a powerful document processing library that enables developers to create, edit, convert, and manipulate Word documents within Node.js applications. Built on the .NET framework, it offers comprehensive support for various document formats, including DOCX, DOC, RTF, HTML, and PDF. By integrating with Node.js, it allows server-side applications to handle complex document automation tasks without requiring Microsoft Word or any other external dependencies. The library provides an extensive API for working with text, images, tables, and styles, making it a versatile solution for document generation and processing in web-based and cloud environments.
With its high-performance document rendering and conversion capabilities, Aspose.Words for Node.js via .NET is ideal for businesses that require automated report generation, large-scale document conversion, or real-time content modification. Developers can leverage its advanced features to extract and manipulate document data, apply formatting, and integrate document processing workflows into their applications. The ability to generate high-fidelity PDFs and maintain document structure across different formats ensures consistency and accuracy in document-heavy applications. Whether used for generating business reports, processing legal documents, or automating document workflows, the library provides a reliable and efficient solution for managing Word documents in a Node.js environment.
Aspose.Words for Node.js via .NET is offered as Developer Small Business, Developer OEM, Developer SDK, Site Small Business, Site OEM and Site SDK licenses catering to a range of business needs. Licenses are perpetual, and include 1 year of support and maintenance. Subscription renewals are also available. See our Aspose.Words for Node.js via .NET licensing page for full details.
Aspose.Words for Node.js via .NET is available individually or as part of the following products:
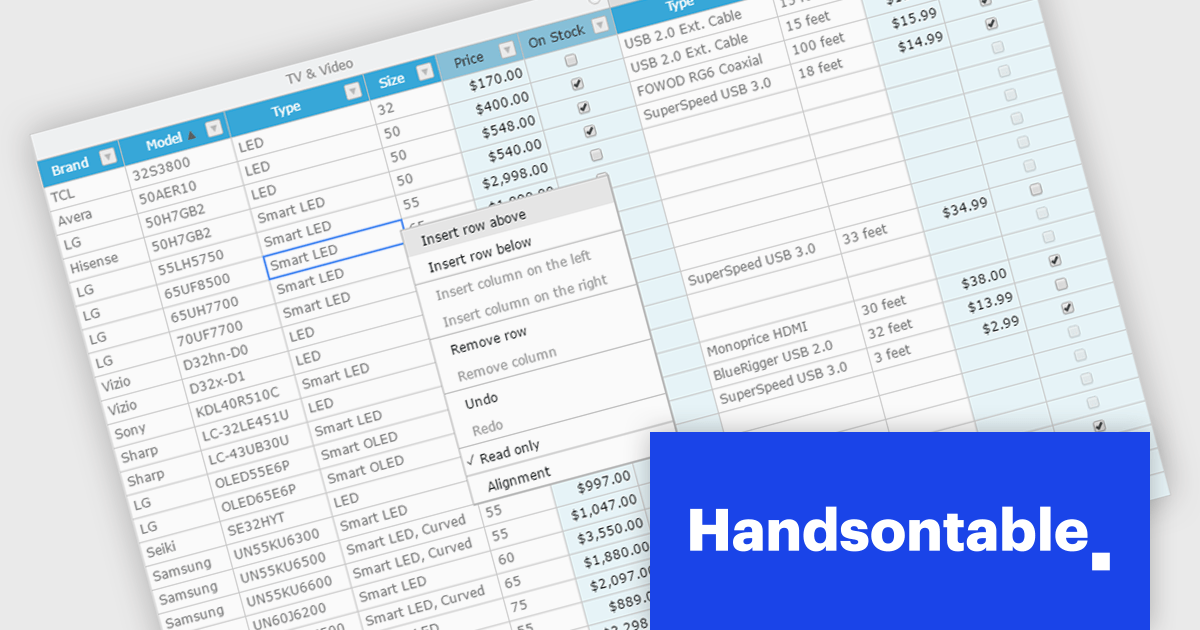
Handsontable is a JavaScript library designed to help developers build interactive data grids into their web applications. Offering a familiar spreadsheet-like interface, it allows users to edit, sort, and filter data with ease. Highly customizable and compatible with popular frameworks like React and Angular, Handsontable empowers developers to build robust data manipulation features into their web applications.
The Handsontable 15.1.0 update enhances table rendering efficiency by reusing and caching cell nodes instead of creating them from scratch during each rendering cycle. This reduces unnecessary DOM manipulations, leading to faster updates, improved responsiveness, and smoother interactions, particularly when handling large datasets. By optimizing how cells are managed, this update minimizes performance bottlenecks, allowing applications to render complex tables more efficiently while maintaining a seamless user experience.
To see a full list of what's new in version 15.1.0, see our release notes.
Handsontable is licensed per developer and is available as an Annual or Perpetual license with 1 year support and maintenance. See our Handsontable licensing page for full details.
For more information, visit our Handsontable product page.
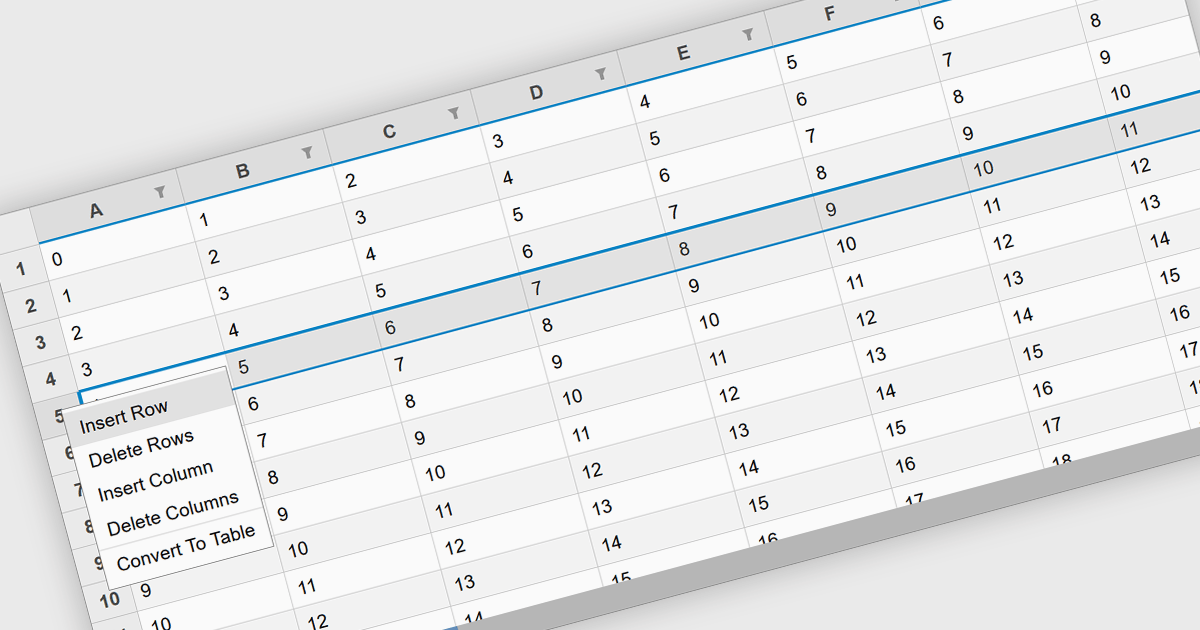
Inserting rows in spreadsheet components is a fundamental feature that allows users to dynamically expand their data sets while maintaining structure and organization. This capability is essential for applications that handle tabular data, enabling seamless modifications without disrupting existing content. Whether used for financial calculations, data analysis, or collaborative editing, the ability to add rows programmatically or through user interaction enhances flexibility and efficiency in spreadsheet-based applications.
Several React spreadsheet controls offer support for inserting rows including:
For an in-depth analysis of features and price, visit our React spreadsheet controls comparison.
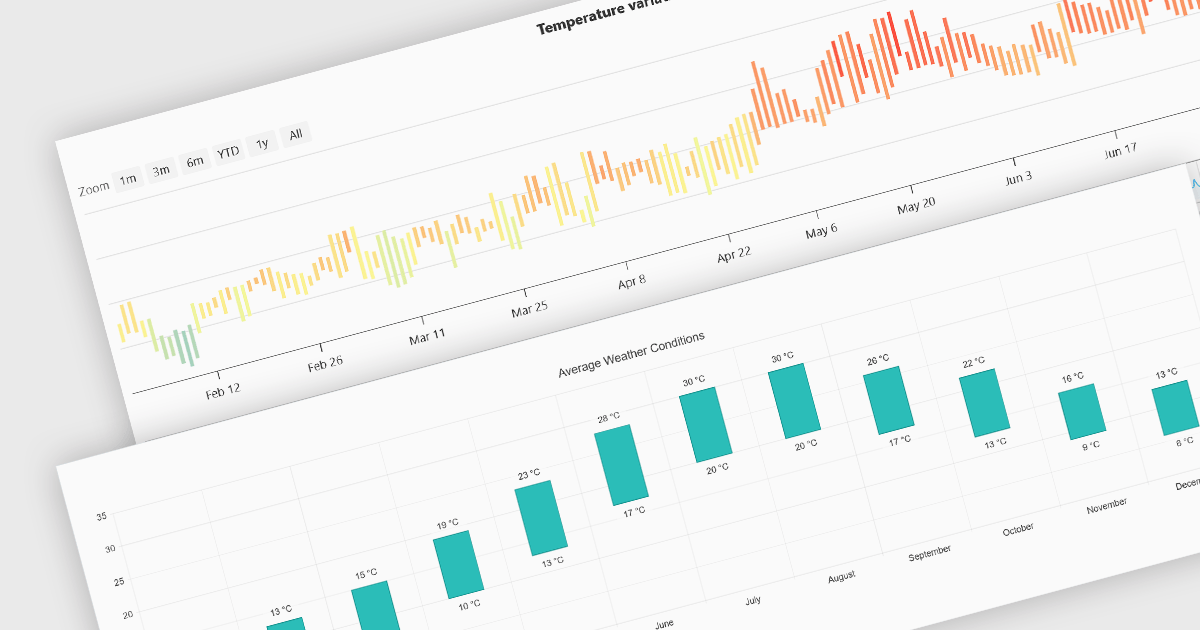
Range bar charts provide a way to visualize data that includes both minimum and maximum values. The bars displayed represent a value range, spanning between the minimum and maximum levels, rather than a single point. This type of chart makes it easier for users to compare variations across different categories or time periods, detect anomalies, and identify trends. This makes them particularly useful for scenarios where understanding variations within a range is important, such as stock price fluctuations, project timelines, or performance metrics. Their structured layout improves readability, making them a valuable tool in financial analysis, scheduling, and business intelligence applications.
Several Angular charting components provide you with range bar charts, including:
For an in-depth analysis of features and price, visit our Angular chart controls comparison.
Tel: (888) 850 9911
Fax: +1 770 250 6199


