













Proveedor oficial
Como distribuidores oficiales y autorizados, le suministramos licencias legítimas directamente de más de 200 editores de software.
Ver todas nuestras marcas.
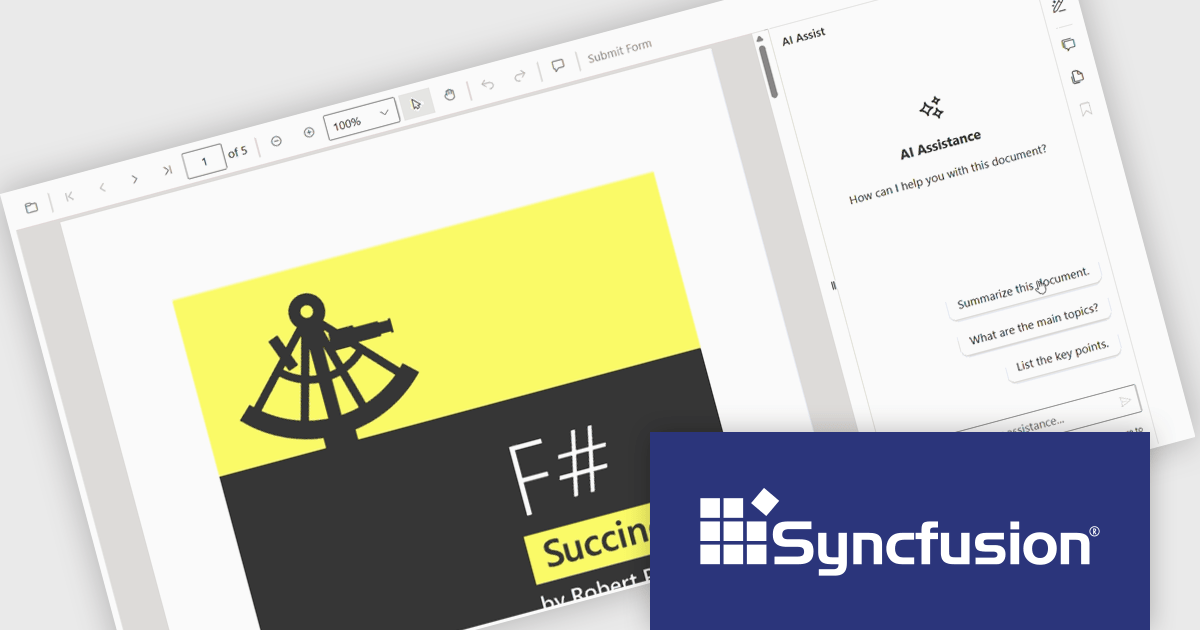
The Syncfusion Essential Studio PDF Viewer SDK is a high performance solution that enables developers to integrate advanced PDF viewing capabilities into web, desktop, and mobile applications. It supports features such as document navigation, annotations, form filling, digital signatures, and collaborative review, allowing users to interact with PDF content efficiently. Designed for reliability and smooth rendering of complex documents, it provides a consistent experience across platforms.
The Syncfusion Essential Studio PDF Viewer SDK 2026 Volume 1 update introduces a document summarizer that enhances how developers deliver efficient document interaction by integrating AI-generated summaries and contextual question-answering directly within PDF viewing applications. This feature enables end users to quickly extract key information and insights from large or complex documents, reducing time spent navigating content and improving overall productivity.
To see a full list of what's new in Syncfusion Essential Studio PDF Viewer SDK 2026 Volume 1, see our release notes.
Syncfusion Essential Studio PDF Viewer SDK is licensed per developer on a one year timed subscription basis, with runtime royalty free redistribution included when the subscription is current, and includes one year of unlimited technical support and updates. See our Syncfusion Essential Studio Spreadsheet Editor SDK licensing page for full details.
Learn more on our Syncfusion Essential Studio PDF Viewer SDK product page.
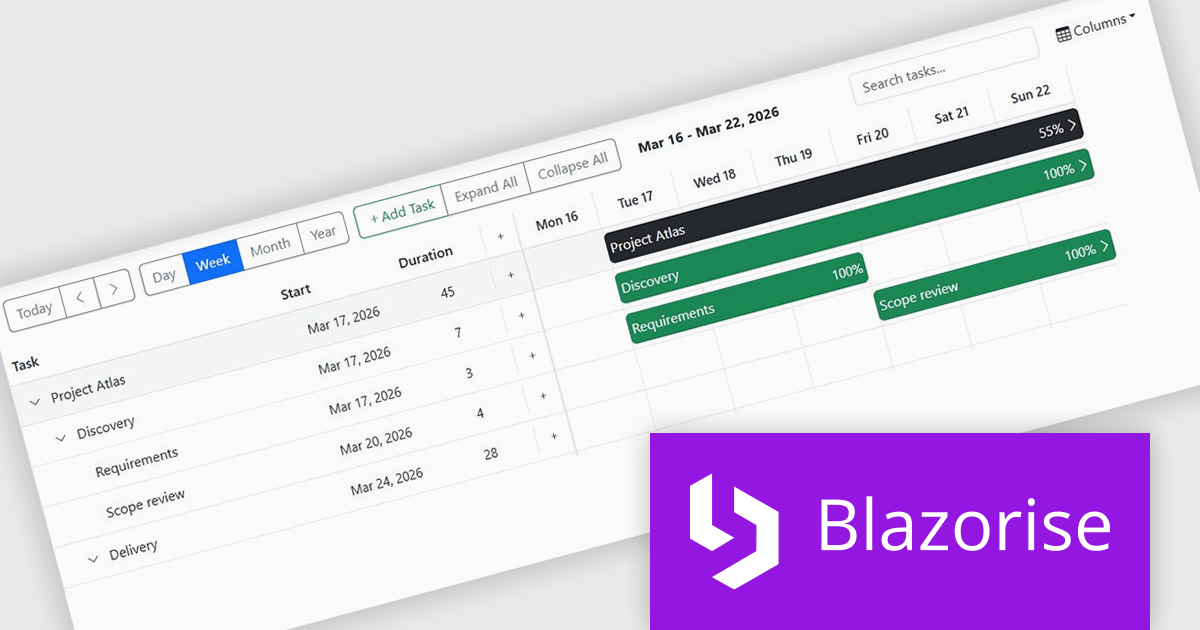
Blazorise is a versatile component library that empowers developers to build modern and feature-rich web applications using Blazor, a client-side web development framework from Microsoft. It offers a comprehensive collection of user interface components, including buttons, forms, charts, and navigation elements, all built with accessibility and responsiveness in mind.
The Blazorise 2.0.3 update introduces a Gantt component that enables developers to implement advanced project planning and timeline visualization directly within their applications, reducing the need for custom development or third party tools while supporting complex scheduling scenarios through features such as task editing, hierarchical data structures, dependency management, filtering, and drag and drop interactions, all within a consistent and theme aligned UI framework.
To see a full list of what’s new in version 2.0.3, see our release notes.
Blazorise is licensed per developer and includes a 1 year subscription for updates and support. Professional, Enterprise, and Enterprise Plus editions are available, each offering tailored levels of support and service to meet varying business needs. See our Blazorise licensing page for full details.
For more information, visit our Blazorise product page.
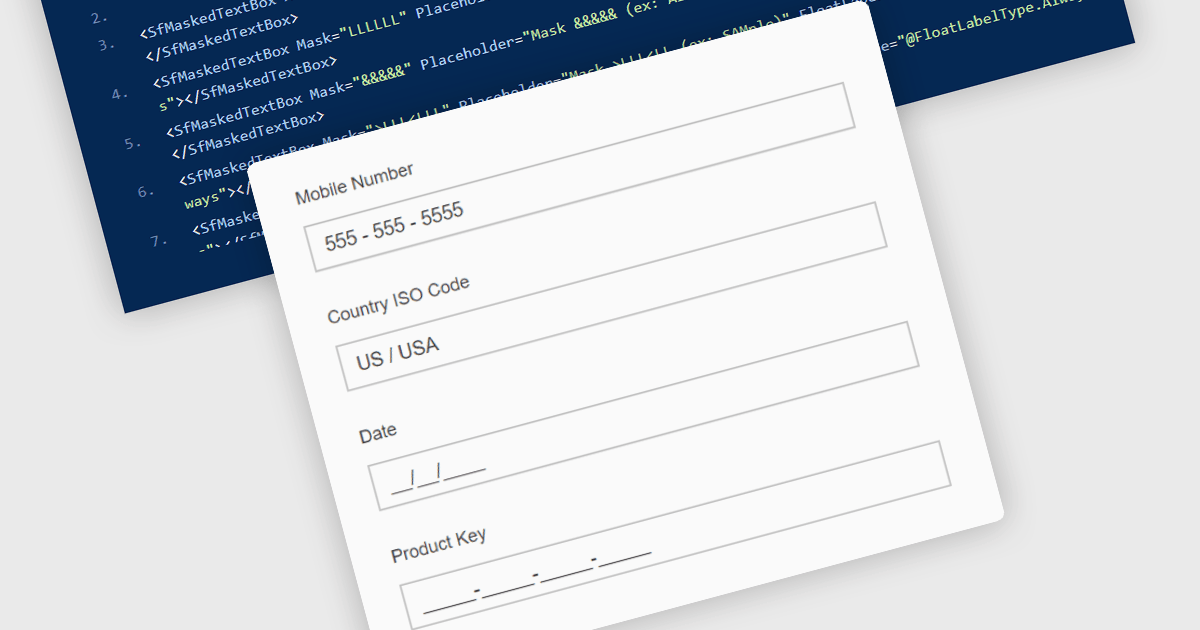
Masked Input Text Box editors are input components that enforce a predefined format while users type, ensuring that entered values follow a specific structure such as phone numbers, dates, postal codes, or identification numbers. By applying an input mask, the editor guides users to enter characters only in valid positions and formats, reducing the likelihood of invalid or incomplete data being submitted. This approach improves data consistency across applications, simplifies validation logic on both the client and server side, and reduces the need for additional parsing or correction of user input. For developers building data-driven Blazor applications, masked input editors help maintain reliable data entry while providing a clear and structured input experience directly within forms and data editing interfaces.
Many .NET Blazor data editor collections contain masked input text box editors including:
For an in-depth analysis of features and price, visit our comparison of .NET Blazor data editors.
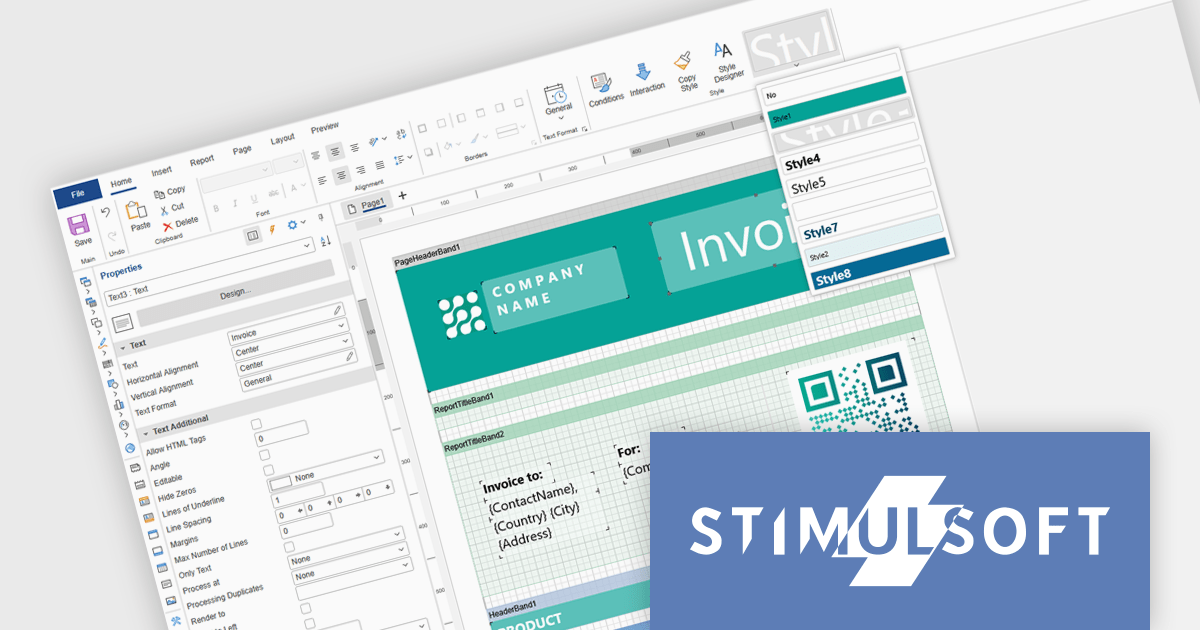
Stimulsoft Ultimate is a reporting and dashboard solution that provides a set of tools for building interactive reports and data visualizations across platforms, including WinForms, ASP.NET, .NET Core, Blazor, JavaScript, WPF, PHP, Java, and Avalonia. It enables developers and organizations to design, generate, and deploy professional reports and dashboards using visual designers, flexible styling options, rich charting and data visualization components, and extensive data connectivity. With support for multiple development environments and technologies, Stimulsoft Ultimate helps teams improve report creation, maintain consistent designs, and deliver clear, data-driven insights for business intelligence, analytics, operational reporting, and enterprise applications.
Stimulsoft Ultimate enables developers to apply centralized report styling that ensures consistent formatting across report elements while reducing the time required to design and maintain reports. By using reusable styles for fonts, colors, borders, and other visual properties, developers can standardize report layouts, quickly apply formatting to multiple components, and implement global design changes without editing each element individually. This approach improves development efficiency, simplifies maintenance, and helps teams deliver professional, visually consistent reports across applications and platforms.
Stimulsoft Ultimate is licensed per developer with Single, Team, Enterprise, and WorldWide options that support one to unlimited developers within an organization. Licenses include a 12 month subscription with updates, priority technical support, a royalty free runtime report designer and viewer, and a build server license for Team and higher tiers. See our Stimulsoft Ultimate licensing page for full details.
For more information, visit our Stimulsoft Ultimate product page.
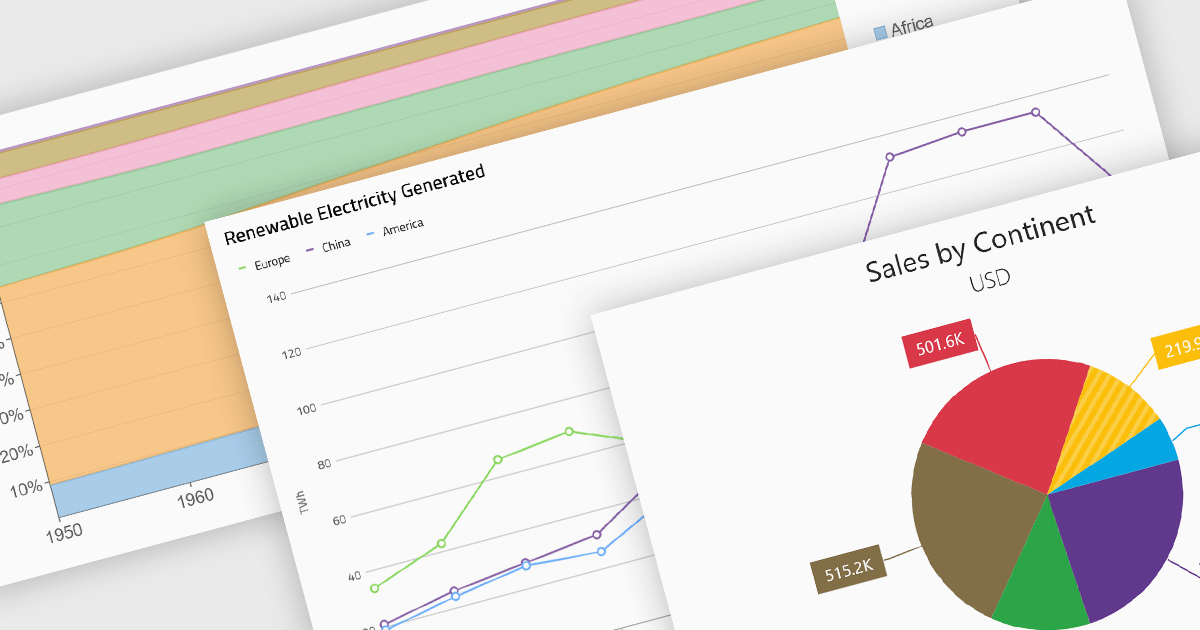
Standard chart types form the foundation of most charting components, providing widely recognized visual formats for representing numerical and categorical data. These charts help developers present trends, comparisons, distributions, and relationships in ways that are immediately understandable to end users. Because these visualizations are familiar across industries, they are commonly included as built-in options in charting libraries and dashboards, allowing applications to communicate insights clearly while supporting interactive features such as tooltips, legends, and dynamic data updates.
Common chart types include:
For an in-depth analysis of features and price, visit our Blazor charts components comparison.
Tel: (888) 850 9911
Fax: +1 770 250 6199


