


Proveedor oficial
Como distribuidores oficiales y autorizados, le suministramos licencias legítimas directamente de más de 200 editores de software.
Ver todas nuestras marcas.

ComponentSource's expertise and global reach have significantly expanded the worldwide accessibility of FusionCharts' data visualization solutions. By leveraging ComponentSource's established distribution network and multilingual support, FusionCharts has connected with a broader international audience of developers and organizations across diverse industries and geographical locations, enabling them to enhance their applications with compelling data insights.
This 5 year partnership between ComponentSource and FusionCharts reflects a shared dedication to empowering developers with best-in-class tools, acknowledging the role of effective data visualization in modern applications. Through this partnership, ComponentSource has played a key role in making FusionCharts flagship product FusionCharts Suite XT more accessible to a global audience.
Now marking 5 years of working together, ComponentSource and FusionCharts are continuing to build on their collaboration. As demand grows for tools that help developers deliver more data-driven and visually rich applications, the partnership remains focused on improving access and simplifying procurement for teams everywhere.
As we celebrate this milestone, we look forward to strengthening our partnership and continuing to provide developers with the tools they need to succeed.
For more information, visit our FusionCharts brand page.
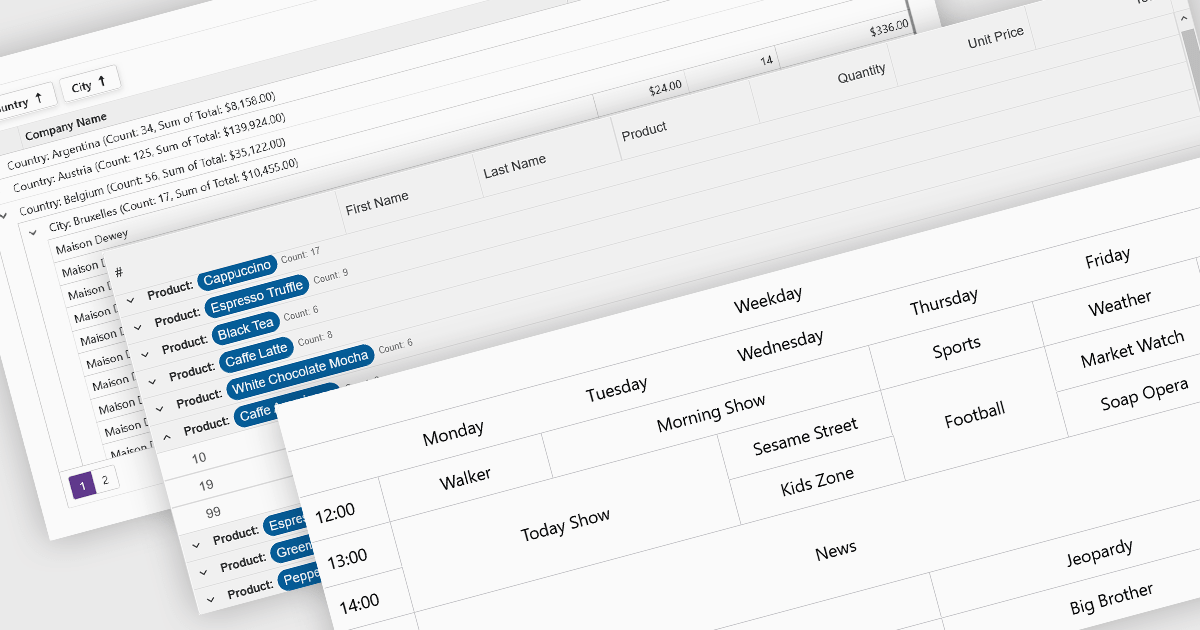
Data visualization and analysis features in grid components transform raw tabular data into structured, interpretable formats that support faster insights and decision-making. These features go beyond static display, offering dynamic ways to organize, summarize, and explore data directly within the grid interface, making it a powerful tool for both end-users and analysts.
Common features include:
For an in-depth analysis of features and price, visit our Blazor grid components comparison.
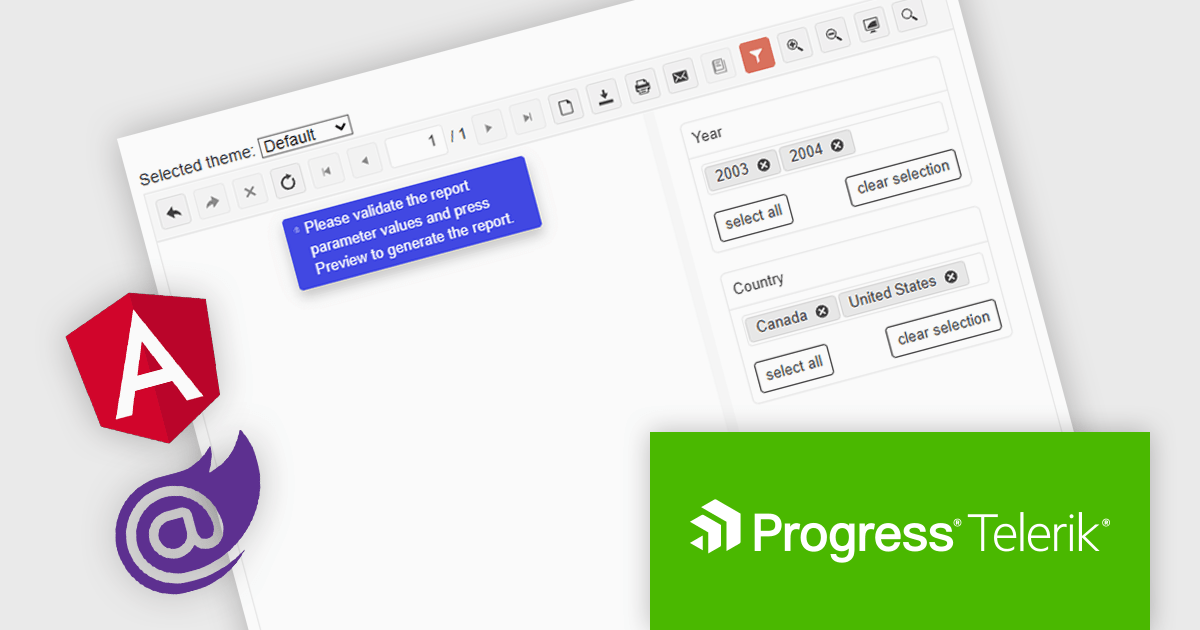
Telerik Reporting is a comprehensive and lightweight embedded reporting tool for .NET web and desktop applications. It enables developers and reporting users to create, design, and export visually appealing, interactive, and reusable reports to effectively present analytical and business data. It supports various technologies, including ASP.NET Core, Blazor, ASP.NET MVC, ASP.NET AJAX, HTML5/JS, Angular, WPF, WinForms, and WinUI.
The Telerik Reporting 2025 Q1 update introduces user-initiated initial report preview in the native Blazor and Angular viewers, giving developers greater control over how and when reports are rendered. Instead of automatically generating reports on viewer load, this feature allows end users to manually trigger the preview process. This improvement helps reduce unnecessary data processing and improves application performance, particularly in scenarios involving large datasets or complex report logic. It also supports more efficient resource management on both the client and server sides, enabling developers to create faster, more responsive, and user-friendly reporting experiences.
To see a full list of what's new in 2025 Q1 (19.0.25.211), see our release notes.
Telerik Reporting is licensed per developer and has two licensing models: an annual Subscription License and a Perpetual License. The Subscription license provides access to the latest product updates, technical support, and exclusive benefits for a flat annual fee, and must be renewed to continue using the software. The Perpetual license is a one-time purchase granting access to the current released version and includes a one-year subscription for product updates and technical support. After this initial period, users can choose to renew the subscription element to continue receiving updates and support; otherwise, they may continue using the installed version available during their active subscription term but will forgo future updates and support. See our Telerik Reporting licensing page for full details.
Telerik Reporting is available to buy in the following products:
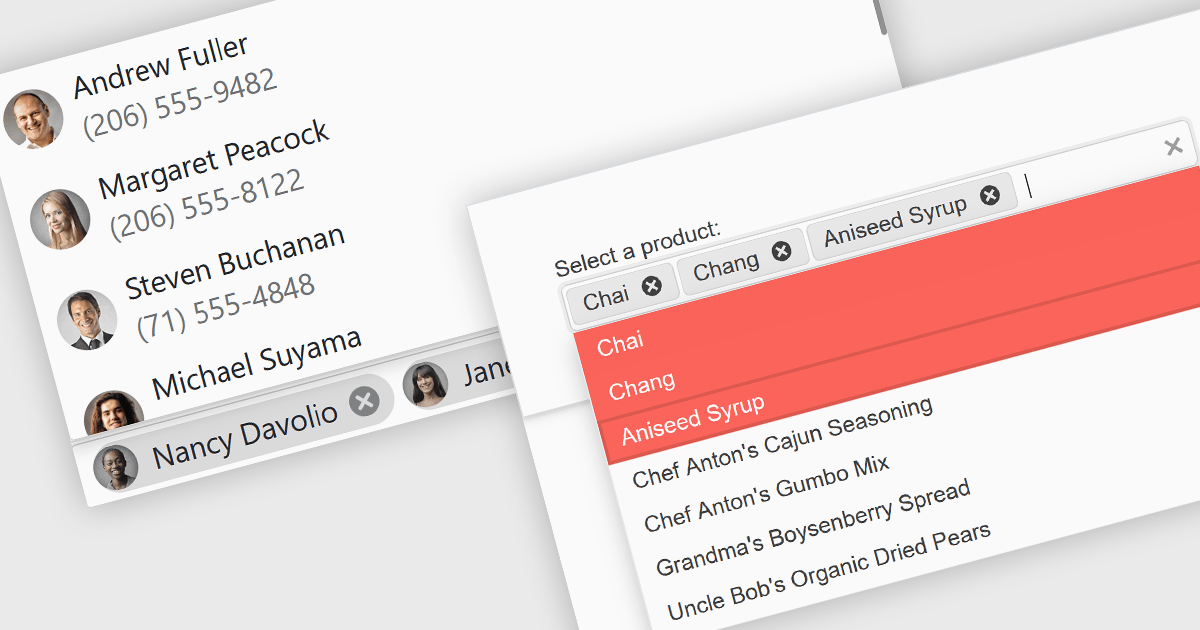
Token or tag boxes provide a user-friendly interface for selecting multiple items from a list. These controls present each selected item as a visually distinct "tag" or "token" within the input area, allowing for quick recognition and easy removal. Ideal for scenarios like multi-category selection or user input of discrete values such as emails or keywords, token boxes enhance both the user experience and data clarity, particularly in web applications that require dynamic form entry or filtering.
Several Blazor Data Editors offer support for token boxes including:
For an in-depth analysis of features and price, visit our Blazor data editors comparison.
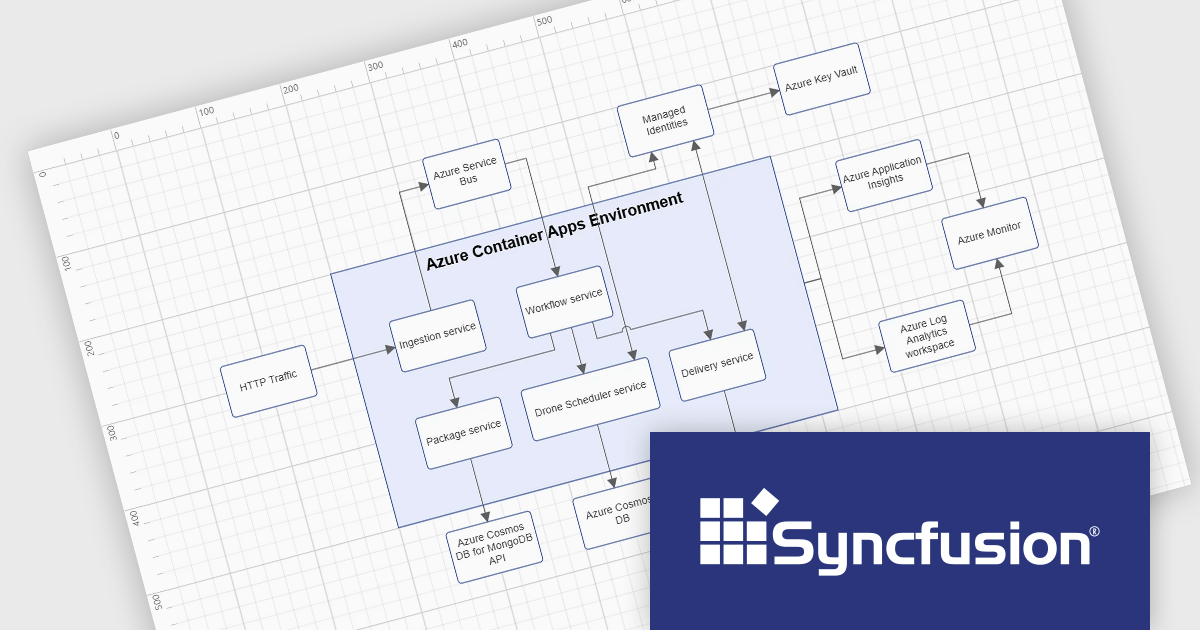
Syncfusion Essential Studio Blazor (available as part of Syncfusion Essential Studio Enterprise) is a comprehensive UI component library designed to accelerate the development of high-performance, modern web applications using the Blazor framework. It boasts over 85+ responsive, lightweight, and modular components spanning various categories such as data visualization, data editing, document processing, and interactive UI elements. This rich repertoire empowers developers to rapidly build user-friendly, feature-rich web interfaces, with seamless integration of both server-side and client-side Blazor applications.
The Syncfusion Essential Studio Blazor 2025 Volume 1 release adds container support to the Diagram component. Containers serve as logical groupings of shapes enclosed by customizable borders, allowing developers to organize and manage collections of diagram elements effectively. This feature enables intuitive drag-and-drop operations during runtime, facilitating the creation of complex diagrams with nested hierarchies. Changes made to the container, such as adjustments to position, size, or style, do not affect its child elements, preserving the integrity of individual components while maintaining overall organization. This enhancement simplifies the development architectural diagrams, and system visualizations, providing end-users with a clearer and more interactive interface for understanding complex relationships.
To see a full list of what's new in 2025 Volume 1, see our release notes.
Syncfusion Essential Studio Blazor is available as part of Syncfusion Essential Studio Enterprise which is licensed per developer starting with a Team License of up to five developers. It is available as a 12 Month Timed Subscription License which includes support and maintenance. See our Syncfusion Essential Studio Enterprise licensing page for full details.
Learn more on our Syncfusion Essential Studio Blazor product page.
Tel: (888) 850 9911
Fax: +1 770 250 6199


