


Proveedor oficial
Como distribuidores oficiales y autorizados, le suministramos licencias legítimas directamente de más de 200 editores de software.
Ver todas nuestras marcas.
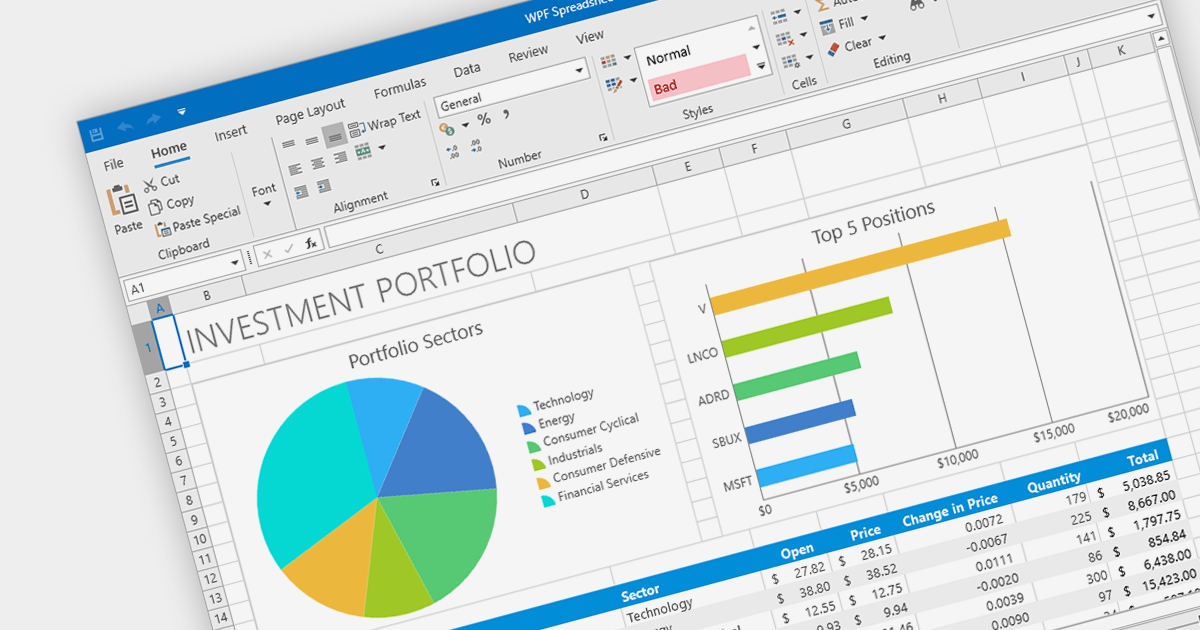
Charts are integral to spreadsheets, enabling users to transform data into visually compelling representations. These graphical formats, such as pie, line, bar, and area charts, effectively convey complex information by highlighting trends, patterns, and anomalies. Spreadsheet software with advanced charting capabilities empowers users to create dynamic charts that adapt seamlessly to data updates, making them invaluable tools for reporting, presentations, and data analysis.
Several .NET WPF spreadsheet components provide chart support including:
For an in-depth analysis of features and price, visit our comparison of .NET Spreadsheet components.
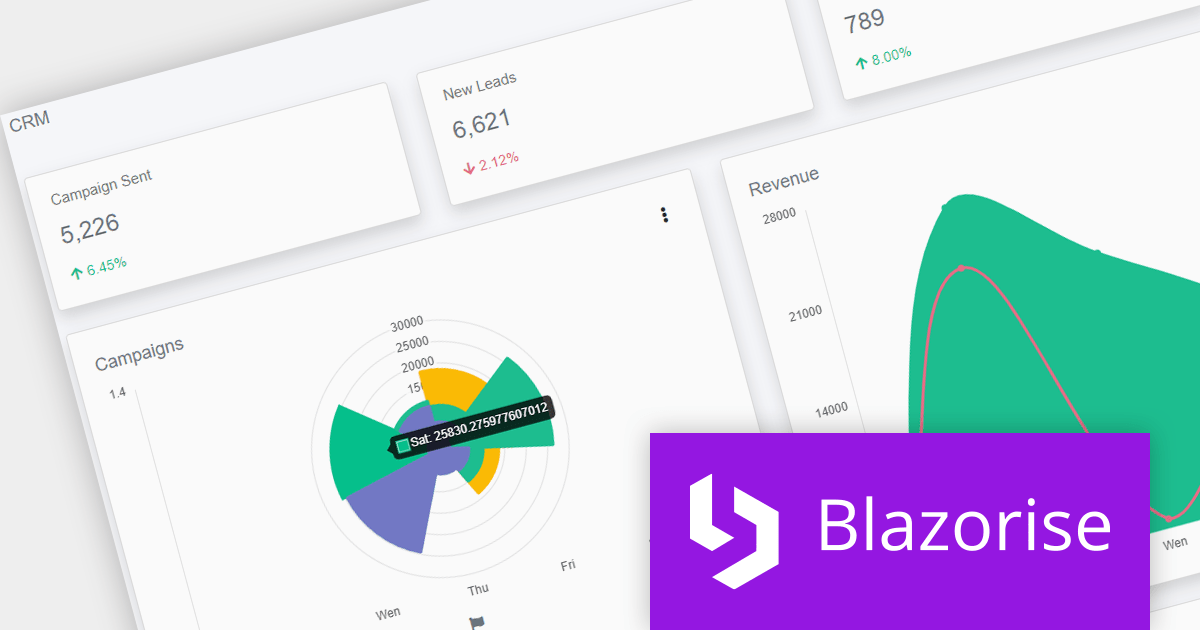
Blazorise is a versatile component library that empowers developers to build modern and feature-rich web applications using Blazor, a client-side web development framework from Microsoft. It offers a comprehensive collection of user interface components, including buttons, forms, tables, charts, and navigation elements, all built with accessibility and responsiveness in mind.
Blazorise 1.3.3 is now fully compatible with .NET 8, providing developers with access to enhanced performance, security, and the latest features of the .NET framework.
To see a full list of what’s new in version 1.3.3, see our release notes.
For more information, visit our Blazorise product page.
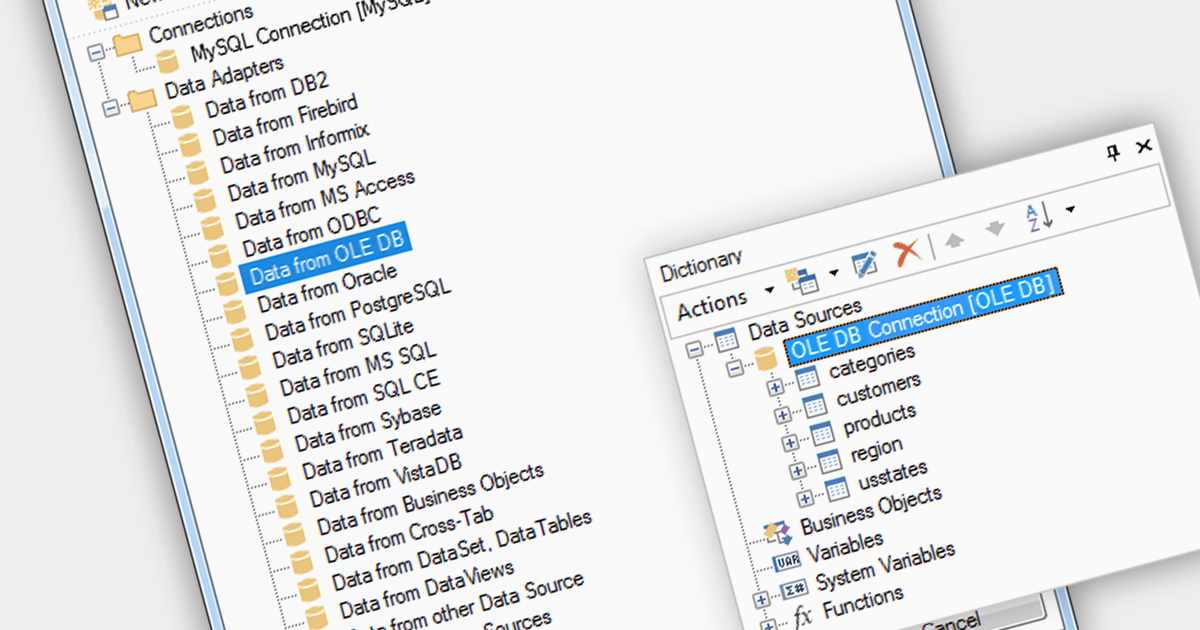
OLEDB data connectivity allows reporting software to connect to various databases and data sources through the Object Linking and Embedding Database (OLEDB) framework. This provides a wide range of data access capabilities within reports, essential for extracting data from relational databases, spreadsheets, and other OLEDB-compatible sources.
Multiple Blazor reporting components are compatible with OLEDB, including:
For an in-depth analysis of features and price, visit our comparison of Blazor reporting components.
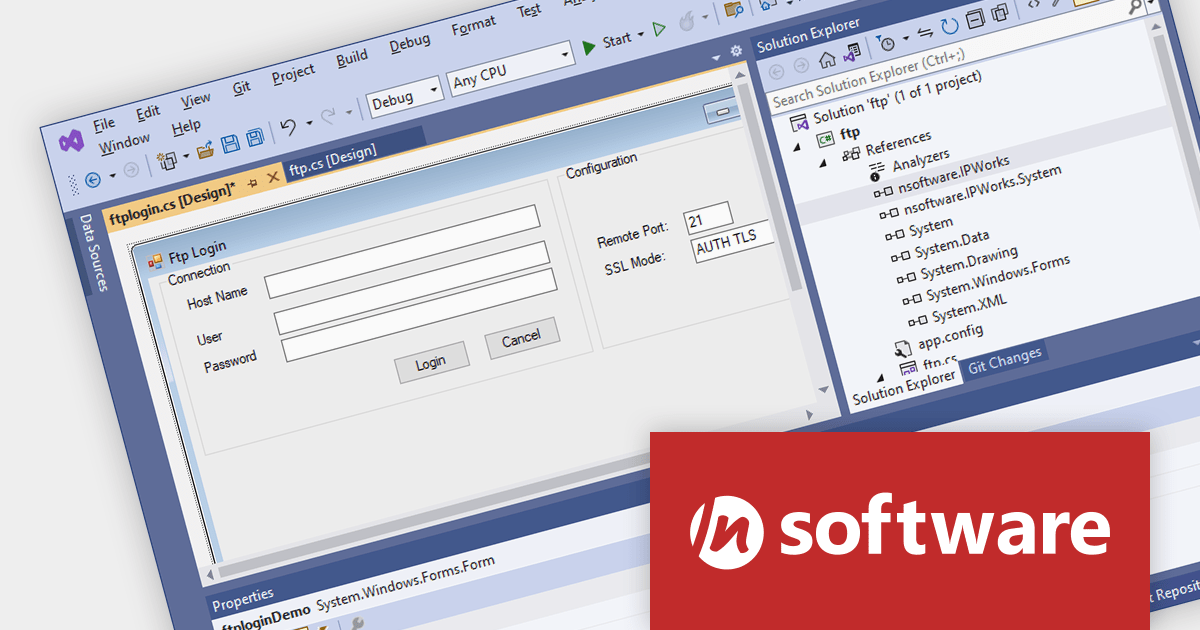
/n software is a leading provider of components for secure Internet communications. For over 30 years, software developers in nearly every Fortune 500 and Global 2000 company worldwide have used /n software products to build powerful connected applications. Popular products include the IPWorks range and the Red Carpet Subscription.
The following /n software products have been updated with support for .NET 8, allowing developers to build communications applications in the latest version of Microsoft's popular framework:

Spread.NET helps you create spreadsheets, grids, dashboards, and forms. It includes a powerful calculation engine with 450+ functions and the ability to import and export Microsoft Excel spreadsheets. Developers can leverage the extensive .NET spreadsheet API and powerful calculation engine to create analysis, budgeting, dashboard, data collection and management, scientific, and financial applications.
In this blog, MESCIUS Product Manager Kevin Ashley takes you through all the steps required to import and export data in CSV files using Spread.NET, including:
He also demonstrates how to use the Spread Designer tool to give users the ability to edit Excel spreadsheet instances inside your running application.
Read the full blog and start integrating CSV data import/export into your Windows applications.
Tel: (888) 850 9911
Fax: +1 770 250 6199


