













Proveedor oficial
Como distribuidores oficiales y autorizados, le suministramos licencias legítimas directamente de más de 200 editores de software.
Ver todas nuestras marcas.
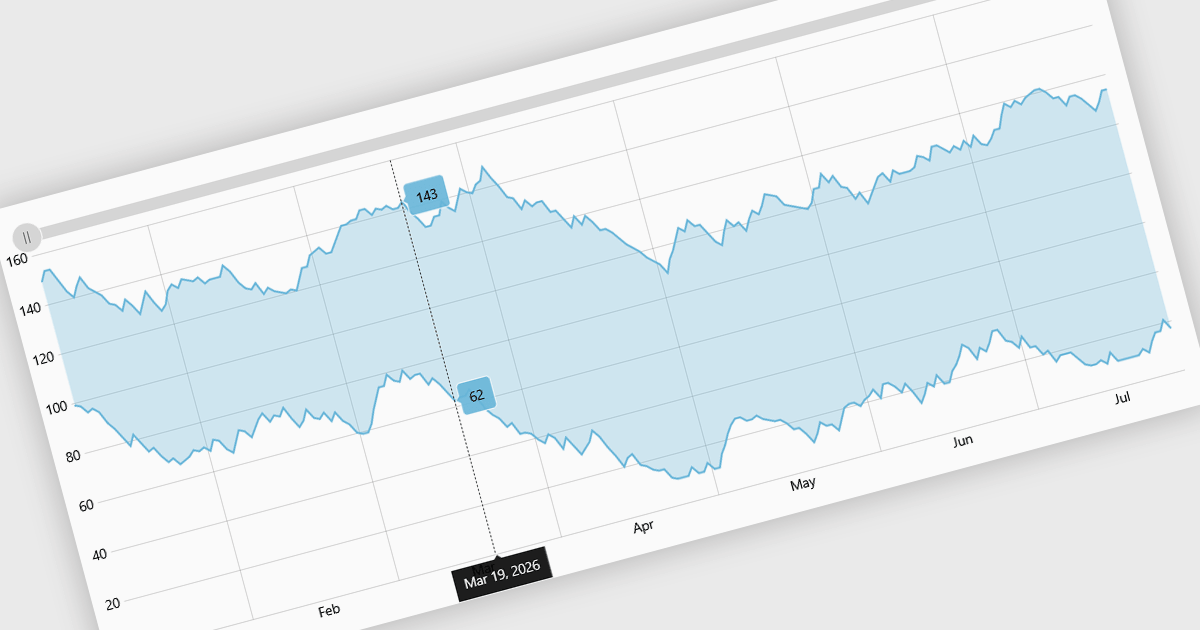
Range charts visualize financial data based on fixed price movements rather than time intervals, grouping activity into consistent ranges to highlight meaningful price action. By filtering out minor fluctuations and market noise, they make trends, volatility, support, and resistance levels easier to identify, especially in fast-moving or irregular markets. Common use cases include technical analysis for trading platforms, monitoring price volatility in equities or cryptocurrencies, and analyzing high-frequency financial data where understanding true market behavior is more important than tracking time-based changes.
Several React charting components provide you with range charts, including:
For an in-depth analysis of features and price, visit our React chart controls comparison.
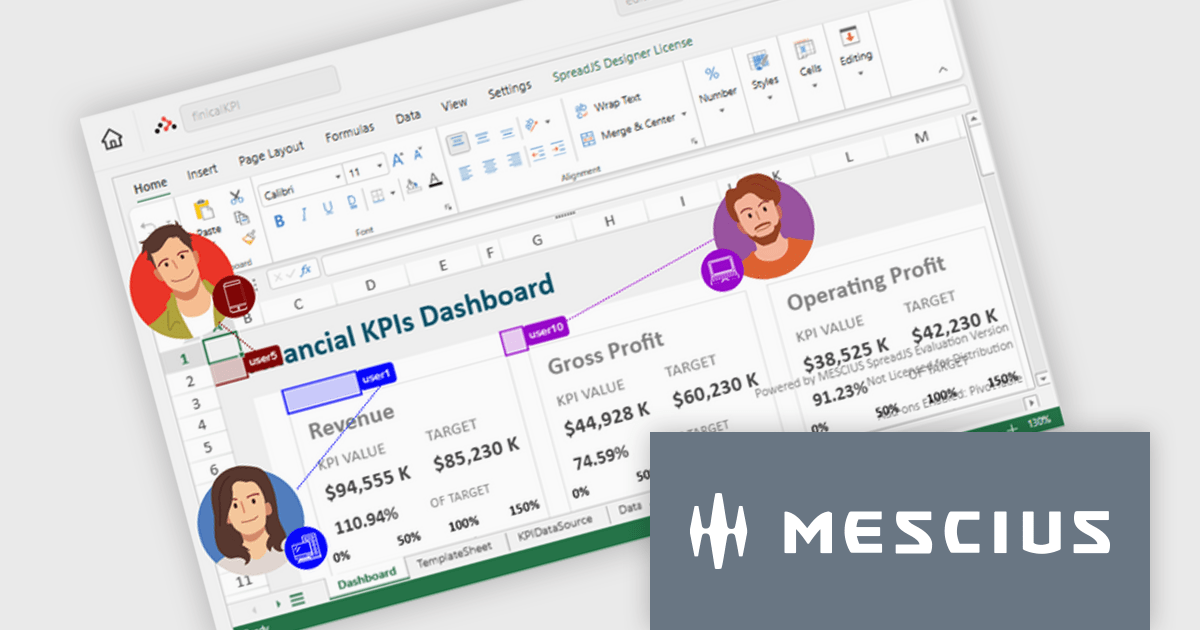
SpreadJS is a JavaScript spreadsheet and data visualization component built to deliver Excel-compatible functionality within web applications. It provides a flexible, high-performance interface for displaying and manipulating tabular data, supporting advanced features such as formulas, pivot tables, charts, conditional formatting, and data binding. SpreadJS integrates smoothly with popular frameworks like React, Angular, and Vue, and includes robust import and export capabilities for Microsoft Excel files. It is commonly used in enterprise applications where users need a responsive, interactive spreadsheet experience directly in the browser.
The SpreadJS 19.0.0 update introduces a new Collaboration Server Add‑on that enables real‑time, multi‑user editing of the same spreadsheet within web applications by integrating the collaboration framework and server infrastructure directly into SpreadJS. This add‑on lets developers build functionality where multiple clients see and apply changes instantly to workbook data with consistent state across users, supports conflict‑free concurrent edits using Operational Transformation logic, and includes features such as live user presence and permission controls.
To see a full list of what's new in 19.0.0, see our release notes.
SpreadJS is licensed per developer and includes 1 Year Maintenance (major and minor version releases and unlimited support phone calls). SpreadJS requires an Annual or Perpetual Deployment License. The optional Add-ons are available at an additional cost, and require a SpreadJS license. See our SpreadJS licensing page for full details.
For more information, visit our SpreadJS product page.
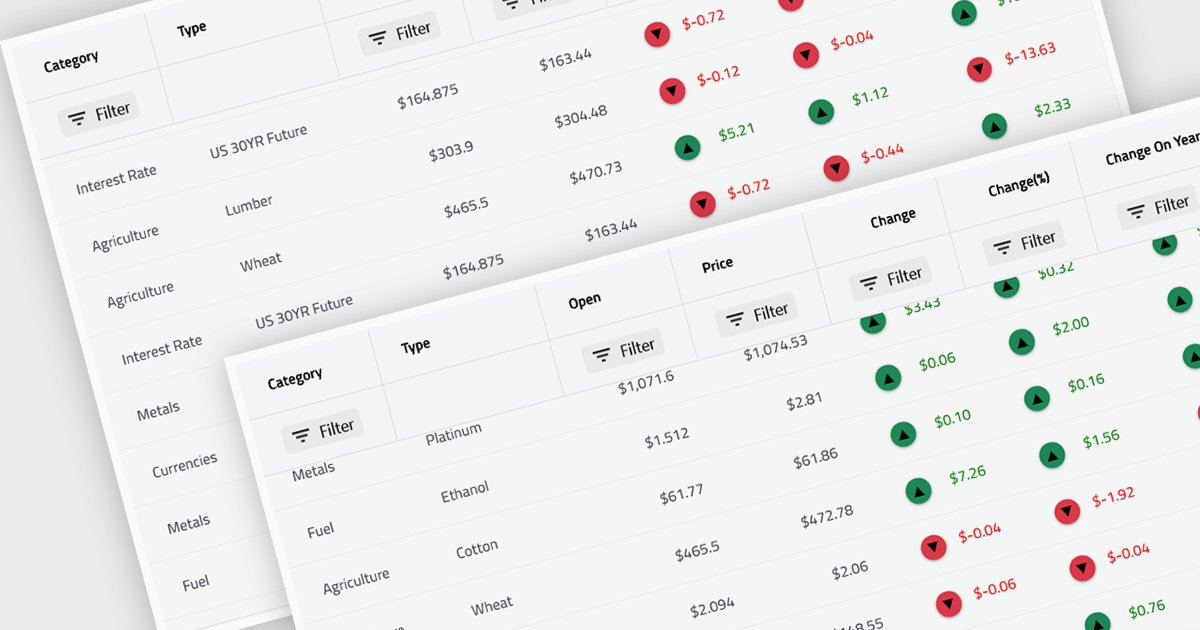
Virtual scroll support in a grid component is a rendering strategy that displays only the rows and columns currently visible in the viewport while dynamically loading and unloading data as the user scrolls. It minimizes DOM size and memory usage by avoiding the creation of off-screen elements, which improves rendering speed, reduces layout thrashing, and maintains smooth interaction even with very large datasets. This approach enables grids to handle millions of records efficiently without requiring pagination, lowers CPU and GPU load, and delivers consistent performance across a wide range of devices.
Several React grid controls offer virtual scroll capability including:
For an in-depth analysis of features and price, visit our React grid controls comparison.
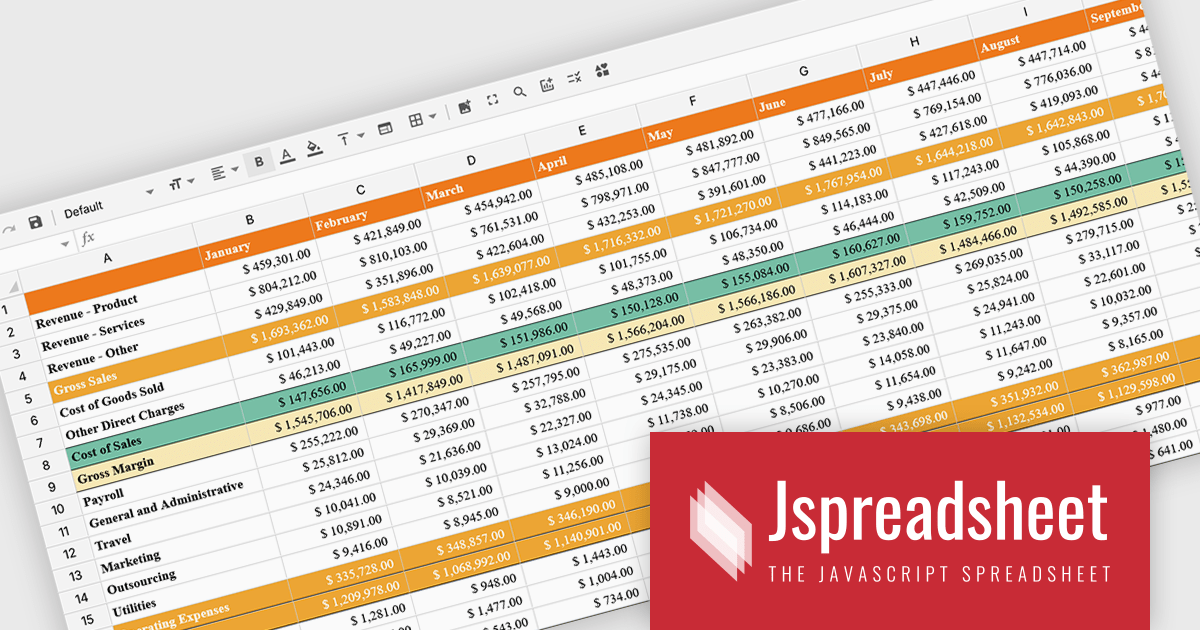
Jspreadsheet Pro is a flexible JavaScript-based spreadsheet solution that enables developers to create customizable, feature-rich data grids for web applications. It offers advanced formulas, data validation, and API integrations. Ideal for tasks like financial modeling, inventory management, and project tracking, it helps businesses efficiently manage and analyze data. Its backend server integration supports real-time data processing, enhancing workflows and boosting productivity across various industries.
The Jspreadsheet Pro v12 update improves handling of large datasets by introducing an extended viewport with optimized rendering that processes only the visible portion of the spreadsheet. This enhancement reduces memory usage, maintains interface responsiveness, and enables smooth interaction even when working with very large or complex data structures. It provides developers with a more scalable foundation for building applications that require high-performance spreadsheet capabilities without compromising speed or usability.
To see a full list of what's new in version 12, see our release notes.
Jspreadsheet Pro is licensed as an Annual or a Perpetual License with support and maintenance. We can supply any Jspreadsheet Pro license including new licenses, maintenance renewals, and upgrade licenses. See our Jspreadsheet Pro for full details.
For more information, visit our Jspreadsheet Pro product page.

ComponentOne Studio Enterprise is a comprehensive suite of .NET UI controls developed by MESCIUS (formerly GrapeCity) designed for building rich, interactive desktop, web, and mobile applications. It provides developers with a broad range of tools and components-including data grids, charts, reports, input controls, and advanced data visualization features-for platforms such as WinForms, WPF, ASP.NET Core, Blazor, WinUI, and .NET MAUI. The suite emphasizes performance, flexibility, and ease of integration, helping teams create consistent, feature-rich user experiences across multiple application types while maintaining a unified development approach.
The ComponentOne Studio Enterprise 2025 v2 update introduces 2D Contour Charts in FlexChart for WPF, allowing developers to represent three-dimensional data on a two-dimensional surface through contour lines or shaded bands that highlight areas of equal value. This capability delivers a clear visual understanding of gradients, surface characteristics, and other continuous data patterns. With support for multiple contour types, customizable contour levels, and flexible gradient color palettes, developers gain precise control over how value transitions are presented. These enhancements make the WPF contour chart well suited for scientific and engineering analysis, elevation and surface mapping, and any application that requires accurate comparison of value distribution across two variables.
To see a full list of what's new in 2025 v2, see our release notes.
ComponentOne Studio Enterprise is licensed per developer on a perpetual basis and includes a 12 month subscription. Priority Support is also available. See our ComponentOne Studio Enterprise licensing page for full details.
Learn more on our ComponentOne Studio Enterprise product page.
Tel: (888) 850 9911
Fax: +1 770 250 6199


