


Proveedor oficial
Como distribuidores oficiales y autorizados, le suministramos licencias legítimas directamente de más de 200 editores de software.
Ver todas nuestras marcas.
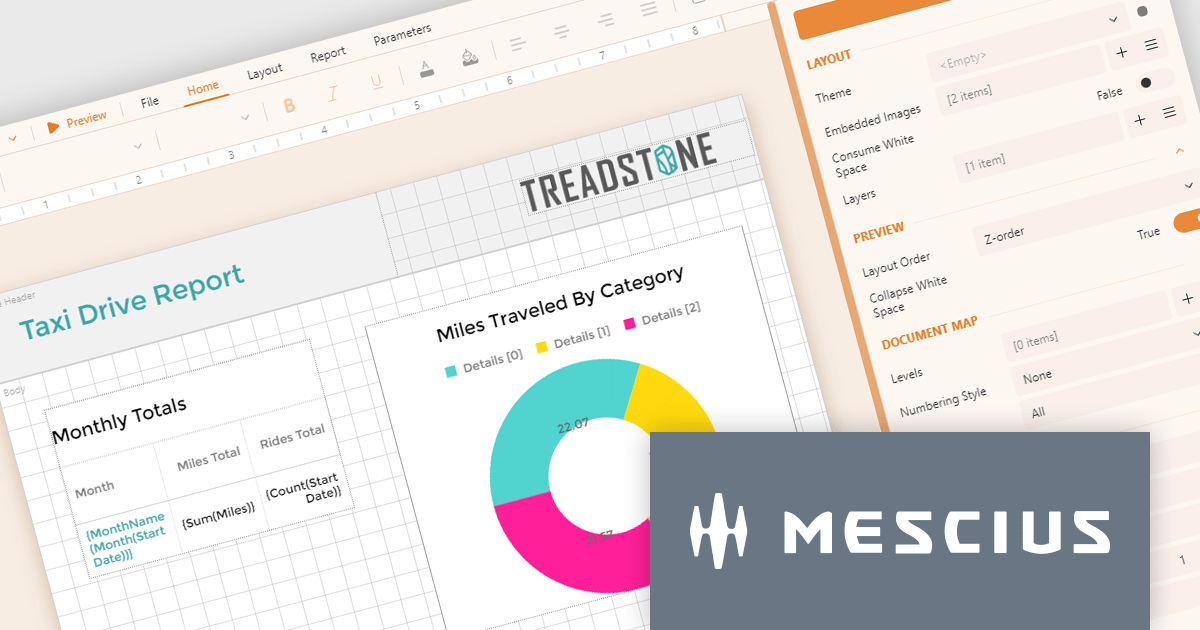
ActiveReportsJS by MESCIUS is a JavaScript reporting toolkit that empowers developers to design and embed interactive reports within web applications. It offers a standalone report designer for crafting reports and a JavaScript report viewer component for seamless integration into web frameworks like React or vanilla JavaScript. This solution streamlines report creation, facilitates data visualization, and delivers a user-friendly report experience.
The ActiveReportsJS 5.0 update modernizes the development experience by refreshing the look and feel of both the Report Designer and Report Viewer components with new icons and colors. This enhances clarity and consistency and improves the design environment. Improved theming capabilities empower you to effortlessly apply pre-defined themes or customize the designer's appearance to match your application's branding, fostering a more cohesive user experience within your web applications.
To see a full list of what's new in 5.0, see our release notes.
ActiveReportsJS is licensed on an annual subscription or perpetual basis and is available as a Single Deployment License for non-commercial use, and as a Single Domain License or Unlimited Domain License for commercial and/or SaaS use. See our ActiveReportsJS licensing page for full details.
Learn more on our ActiveReportsJS product page.
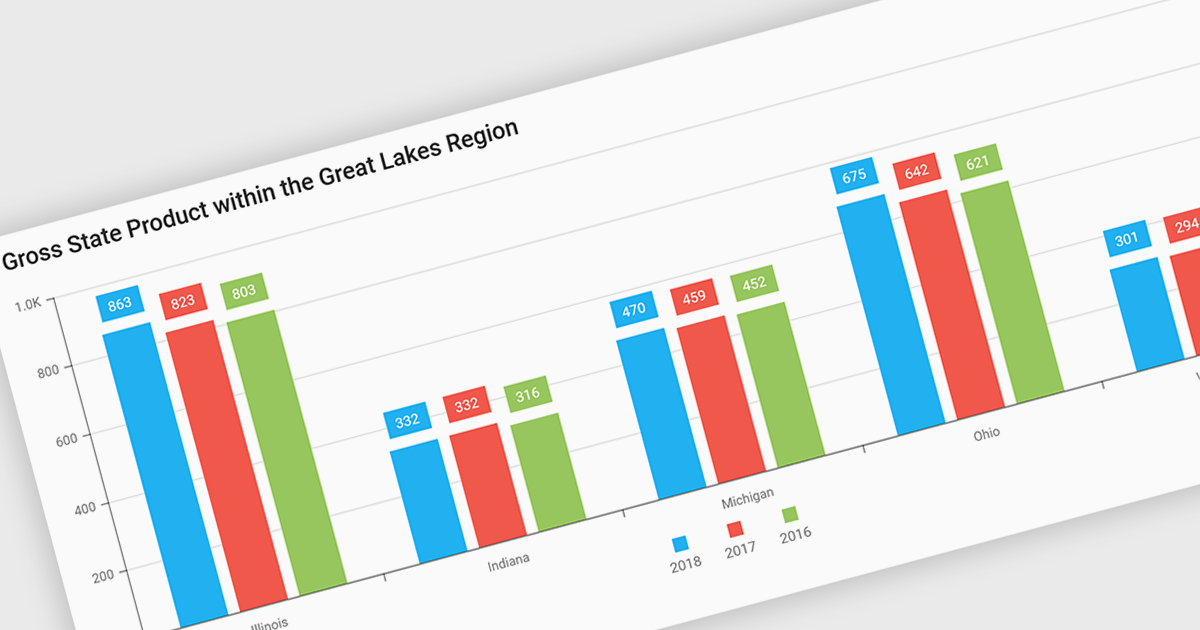
Bar and column charts, though sometimes referred to interchangeably, are vital tools for visualizing data within software applications. Their simple format, with bars representing categories and their lengths proportional to corresponding values, allows users to quickly grasp comparisons between different data sets. This makes them ideal for dashboards displaying sales figures across regions, project management tools tracking task completion rates, or any scenario where users need to compare metrics at a glance. Their effectiveness lies in their ability to present complex information in a clear and concise manner, facilitating informed decision-making within software applications.
Several React Chart controls offer column and bar charts including:
For an in-depth analysis of features and price, visit our React Chart controls comparison.

Localization capabilities in PDF viewer components allow for a user-friendly experience across various languages. By providing translated text and right-to-left support for interface elements like menus, buttons, and error messages, viewers can navigate and interact with PDFs in their native language. This improves international accessibility and fosters a wider user base for applications that utilize PDF documents.
Several React PDF Viewer controls offer localization including:
For an in-depth analysis of features and price, visit our React PDF Viewer controls comparison.

Sencha Ext JS is a comprehensive JavaScript framework designed for building data-intensive, cross-platform web applications with rich user interfaces. It offers a robust set of components and tools for developing feature-rich applications, including a powerful grid system, advanced data handling capabilities, and an extensive library of UI components. With a focus on high performance and flexibility, Ext JS allows developers to create responsive applications that run seamlessly on various devices and browsers.
The Sencha Ext JS 7.8 update introduces the integration of the Froala Editor with the classic toolkit, enhancing the web development experience by providing a powerful and user-friendly rich text editor. This addition enables developers to easily incorporate advanced text editing features into their applications, offering end users a seamless and intuitive interface for content creation and formatting. The Froala Editor's modern capabilities, such as inline editing, real-time collaboration, and a variety of formatting options, streamline the process of managing and displaying content within applications, thereby improving overall productivity and user engagement. This integration exemplifies Sencha's commitment to providing robust, efficient tools for modern web development.
To see a full list of what's new in 7.8, see our release notes.
Sencha Ext JS is available in Pro, Enterprise and Ultimate editions, as Annual Subscription or Perpetual Licenses. See our Sencha Ext JS licensing page for full details.
For more information, see our Sencha Ext JS product page.
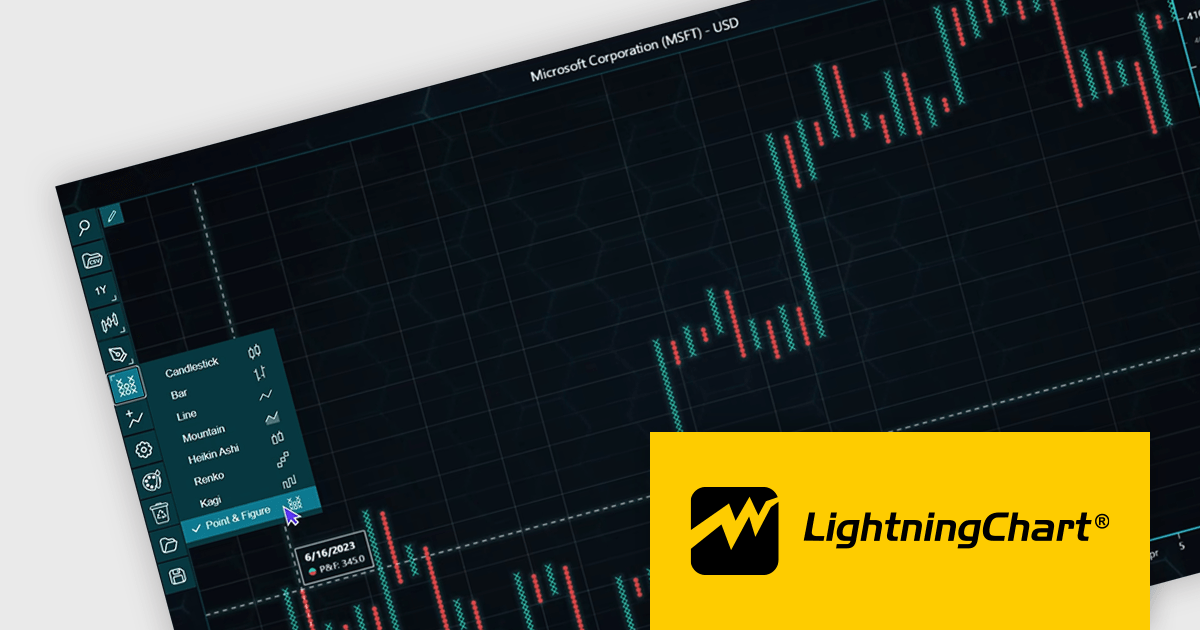
LightningChart JS Trader is a JavaScript/TypeScript library developed by LightningChart that specifically targets the creation of financial and trading applications. It provides high-performance, 2D, 3D, and real-time charting controls and a comprehensive suite of visualizations including candlestick, bar, line, and various technical indicators and drawing tools. This library enables software developers to craft interactive technical analysis tools without the need for server-side setup as it runs completely on the client device.
The LightningChart JS Trader v2.0 update expands its technical analysis toolkit by introducing more chart types, such as Heikin Ashi, Renko, Kagi, and Point-and-Figure charts. These additional chart types equip developers with a wider range of visualization options, significantly enhancing market trend analysis capabilities and allowing them to adapt to different analytical needs and trading strategies.
To see a full list of what's new in v2.0, see our release notes.
LightningChart JS Trader is licensed per developer and is available as an annual license with 1 year support. See our LightningChart JS Trader licensing page for full details.
For more information, see our LightningChart JS Trader product page.
Tel: (888) 850 9911
Fax: +1 770 250 6199


