













Proveedor oficial
Como distribuidores oficiales y autorizados, le suministramos licencias legítimas directamente de más de 200 editores de software.
Ver todas nuestras marcas.
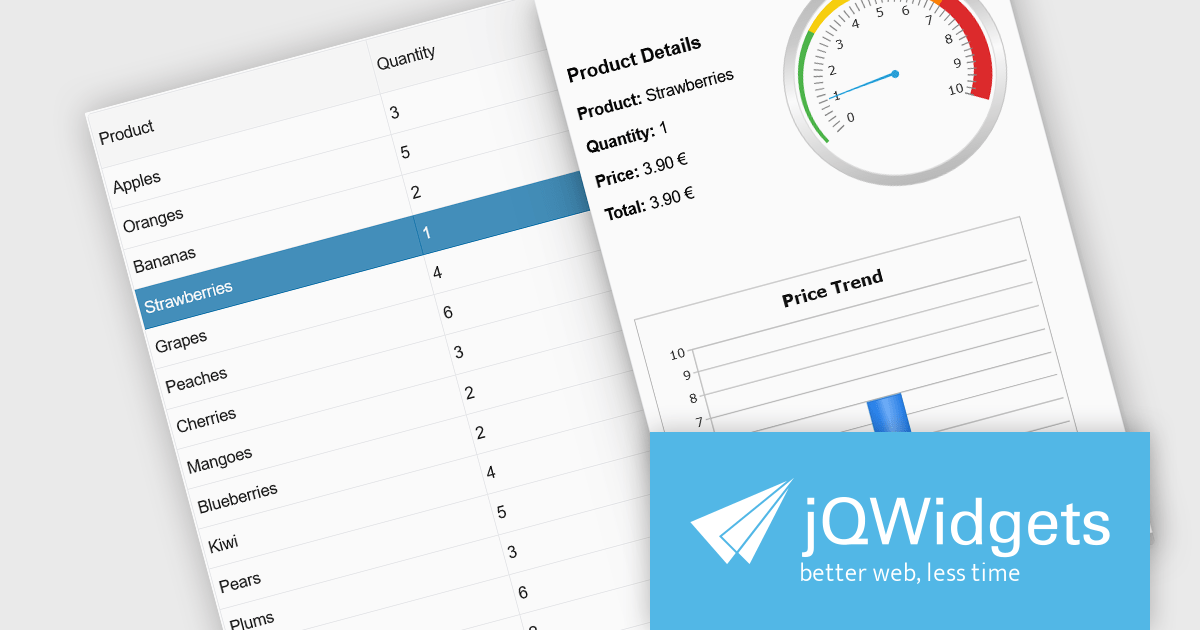
jQWidgets is a comprehensive JavaScript UI framework offering a robust collection of over 60 widgets, themes, and utilities for building professional-grade, cross-platform web applications. Built on jQuery, HTML5, and CSS, it provides extensive functionality including data grids, charts, navigation, input validation, and more. jQWidgets simplifies web development, ensuring your applications work seamlessly across desktop browsers, tablets, and smartphones.
The jQWidgets v23.0.0 release adds a new side panel feature in jqxGrid, allowing developers to add custom HTML elements directly into side panels positioned next to the grid. Whether you want to include filters, charts, summaries, help text, or interactive widgets, the side panel supports any type of content.
To see a full list of what's new in v23.0.0, see our release notes.
jQWidgets is licensed per developer and is available as a Perpetual license 1 year support and maintenance. See our jQWidgets licensing page for full details.
Learn more on our jQWidgets product page.
LightningChart JS is a JavaScript/TypeScript library developed by LightningChart that is particularly well-suited for data-intensive visualizations, offering exceptionally fast rendering capabilities thanks to its use of WebGL. This makes it a strong choice for applications that require real-time data updates, such as financial platforms, engineering tools, scientific research dashboards, and industrial monitoring systems. It provides high-performance, 2D, 3D, and real-time charting controls and a comprehensive suite of visualizations including candlestick, bar, line, and various technical indicators and drawing tools. This library enables software developers to craft interactive technical analysis tools without the need for server-side setup as it runs completely on the client device.
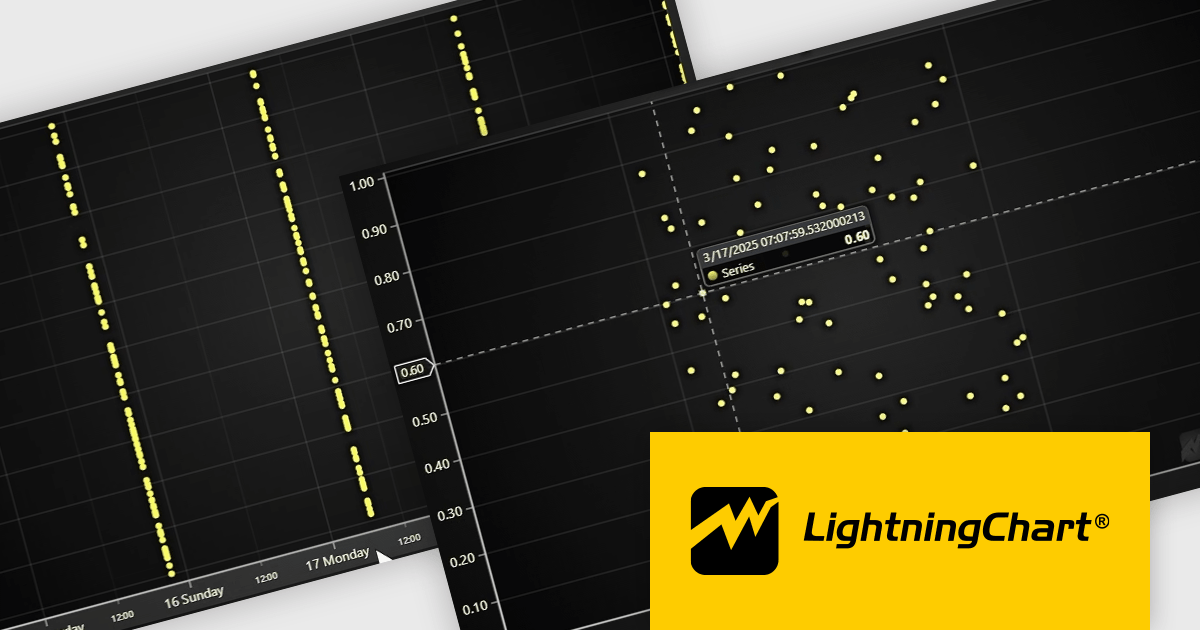
The LightningChart JS v7.1 update enhances its Date-Time axis capabilities by introducing support for nanosecond-resolution timestamps, allowing users to zoom into microsecond and nanosecond ranges for more granular time-based data analysis—well beyond the previous millisecond limitations. To utilize this feature, timestamps should generally be supplied as BigInt64. This update positions LightningChart JS among the few web charting libraries explicitly supporting nanosecond precision, making it a strong choice for applications requiring high-resolution temporal data visualization.
To see a full list of what's new in v7.1, see our release notes.
LightningChart JS is licensed per developer and is available as an annual license with 1 year support. See our LightningChart JS licensing page for full details.
For more information, see our LightningChart JS product page.
Smart UI by Smart HTML Elements is an enterprise-grade UI library offering pre-built web components for developers in Angular, React, Vue, Blazor, and JavaScript. It boasts over 60 ready-to-use components like grids, charts, schedulers, and editors, all featuring two-way data binding, responsiveness, accessibility, and theming capabilities. This library helps developers rapidly build dynamic and modern web applications with consistent look-and-feel and rich functionalities, accelerating development time and ensuring professional quality.
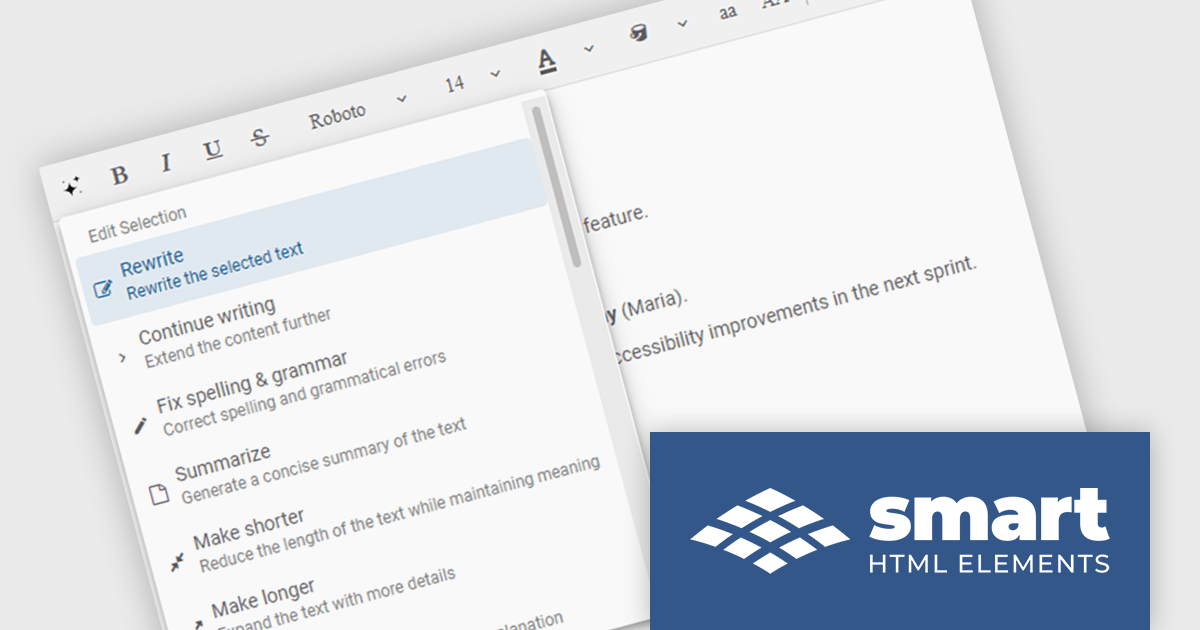
The Smart UI v23.0.0 release adds new features to Smart.Editor, including content generation, text summarization and the ability to rewrite, expand or shorten content by using AI. These capabilities enable users to quickly craft content, distill lengthy text into key points, and tailor messaging with precision, all without leaving the editing environment. Whether expanding a brief idea into a full paragraph or condensing verbose content for clarity, the new AI tools simplify content creation and editing.
To see a full list of what's new in v23.0.0, see our release notes.
Smart UI (Smart HTML Elements) is licensed per developer and is available as a perpetual license with 1 year support and maintenance. It includes distribution to unlimited Web applications, SaaS projects, Intranets and Websites. Team, OEM and Enterprise licensing options are also available. See our Smart UI (Smart HTML Elements) licensing page for full details.
Learn more on our Smart UI product page.
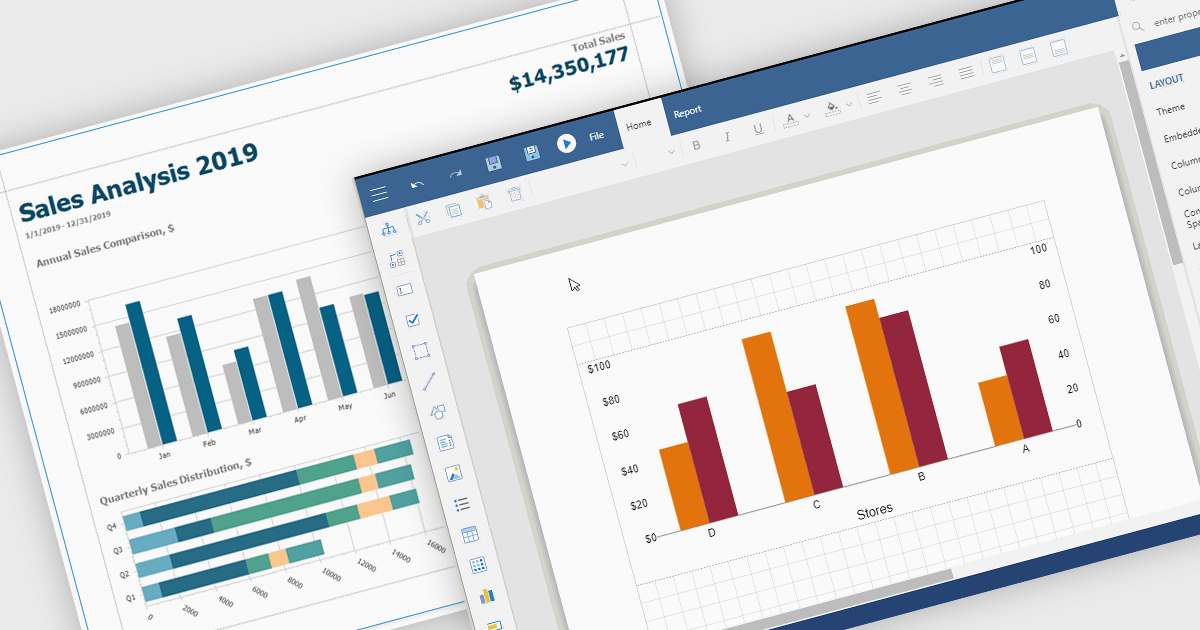
Charts in reports are graphical representations of data such as bar graphs, line charts and pie diagrams that are incorporated into business documents to illustrate key insights and trends at a glance. By converting numbers into intuitive visuals, charts improve clarity and make comparisons between categories or time periods effortless while drawing attention to critical metrics like sales growth, customer churn or budget variances. These visual tools streamline data interpretation, empower stakeholders to make faster more informed decisions, foster alignment across departments and tell a cohesive data driven story without wading through rows of figures.
Several Vue.js reporting components support charts including:
For an in-depth analysis of features and price, visit our Vue.js Reporting Components comparison.
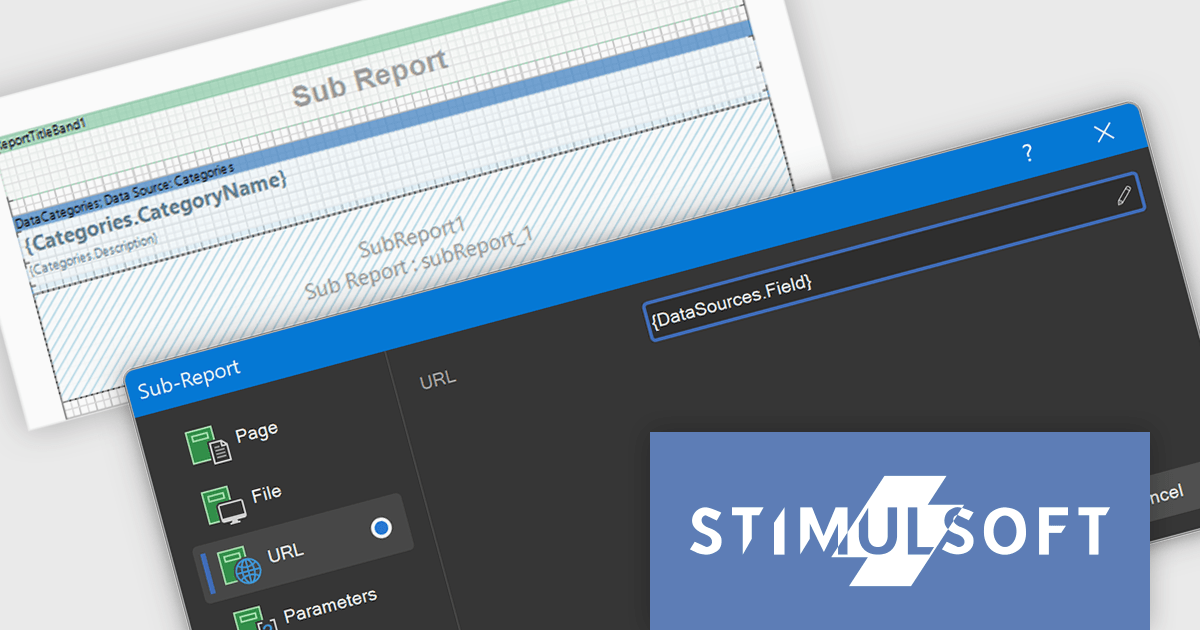
Stimulsoft Reports.JS provides a robust reporting toolkit designed specifically for JavaScript applications. This library leverages a client-side architecture, offering a pure JavaScript report engine for efficient report rendering directly within web browsers. The solution includes a user-friendly report designer for building reports with various data sources and visualizations, along with a report viewer for seamless integration and display within your JavaScript applications. This eliminates the need for server-side dependencies or browser plugins, simplifying the development process for embedding powerful reporting functionalities into your web projects.
The Stimulsoft Reports.JS includes expressions within the URL and File fields of the Sub-Report component. This functionality helps developers to dynamically determine the source of a sub-report, whether it is a file path or a web address, based on the evaluation of expressions. Consequently, this allows for the creation of more adaptable and context-aware reports where the embedded sub-report content or linked resources are determined programmatically based on the main report's data, offering greater flexibility in report design and data integration without the need for static configurations.
Stimulsoft Reports.JS is licensed per developer and is available as a Perpetual license with 1 year support and maintenance. See our Stimulsoft Reports.JS licensing page for full details.
Stimulsoft Reports.JS is available individually or as part of Stimulsoft Ultimate.
Tel: (888) 850 9911
Fax: +1 770 250 6199


