


Proveedor oficial
Como distribuidores oficiales y autorizados, le suministramos licencias legítimas directamente de más de 200 editores de software.
Ver todas nuestras marcas.
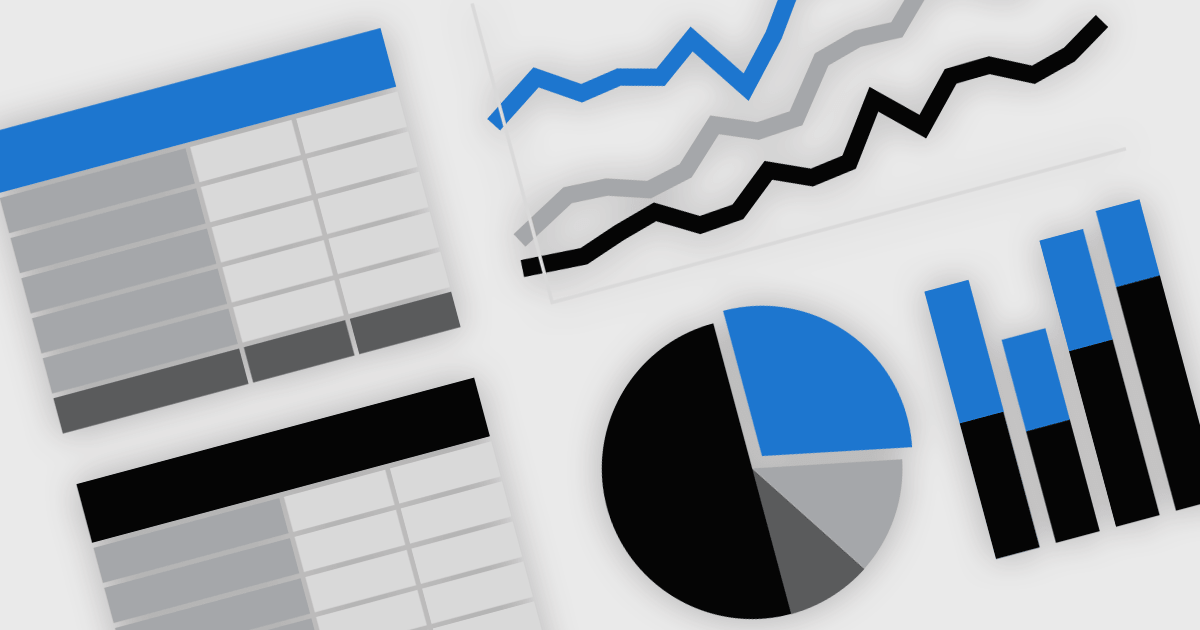
Effective data processing and presentation features are an essential part of modern reporting components, enabling users to organize, analyze, and display data in a meaningful way. These capabilities transform raw information into structured, interactive reports that support better decision-making. By allowing users to manipulate data dynamically, apply business rules, and customize the way information is displayed, these features ensure reports remain relevant, insightful, and easy to interpret across different use cases.
Common features include:
For an in-depth analysis of features and price, visit our Vue.js Reporting controls comparison.
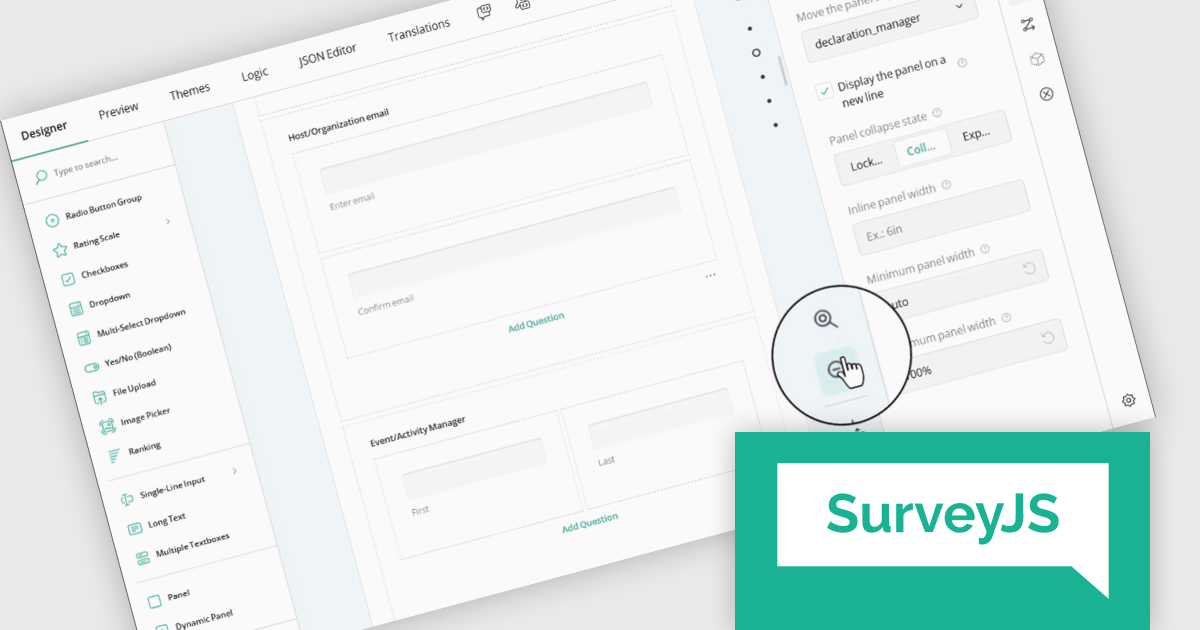
SurveyJS Survey Creator is a JavaScript library that enables developers to embed a drag-and-drop survey and form builder directly within their web applications. It provides a comprehensive UI for designing surveys with various question types, logic branching, and layout customization, generating JSON schemas that can be used by the SurveyJS Survey Library to render and process the surveys. This allows for the creation of dynamic and user-configurable data collection tools without requiring extensive custom development, streamlining the process of integrating survey functionality into applications.
The SurveyJS Survey Creator 2.0.0 release adds support for scaling, enabling users to dynamically adjust the zoom level of the survey design surface. This functionality provides control over the visual representation of forms, allowing users to zoom in for detailed editing of intricate elements or zoom out for a comprehensive overview of complex, multi-page surveys. A dedicated "Zoom to 100%" button ensures a quick and effortless return to the default view.
To see a full list of what's new in version 2.0.0, see our release notes.
SurveyJS Survey Creator is licensed per developer with a one-time payment for indefinite use. Access to updates and technical support is available through a subscription. See our SurveyJS Survey Creator licensing page for full details.
Learn more on our SurveyJS Survey Creator product page.
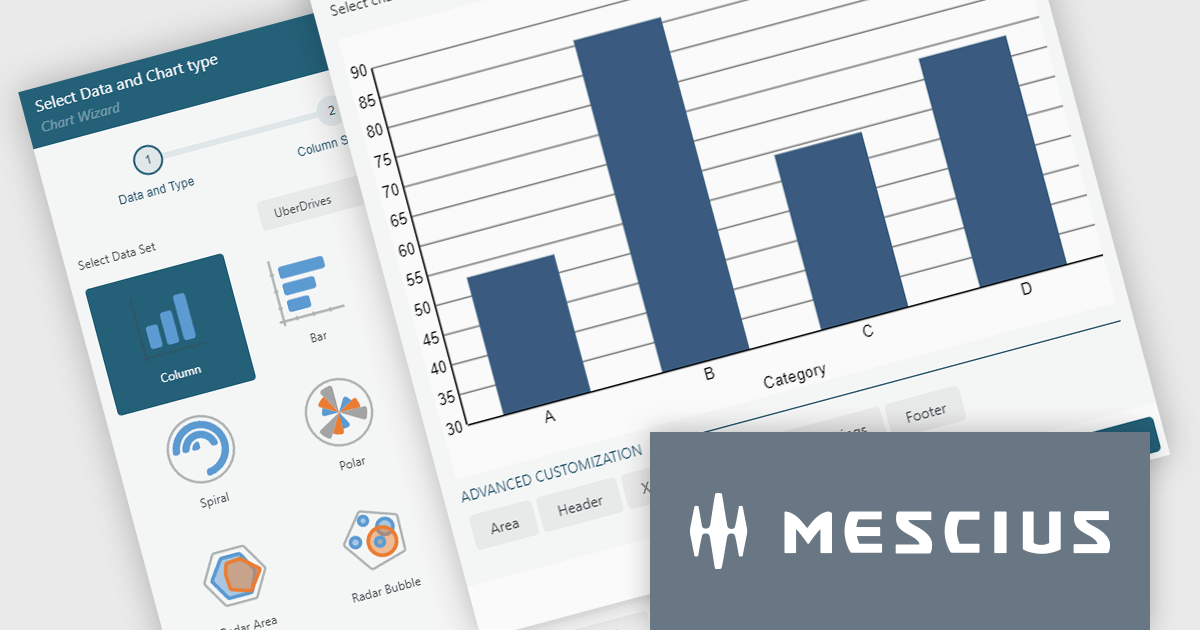
ActiveReportsJS by MESCIUS is a JavaScript reporting toolkit that empowers developers to design and embed interactive reports within web applications. It offers a standalone report designer for crafting reports and a JavaScript report viewer component for seamless integration into web frameworks like React or vanilla JavaScript. This solution streamlines report creation, facilitates data visualization, and delivers a user-friendly report experience.
The ActiveReportsJS 5.2 update introduces a completely revised chart report item, offering greater flexibility and control over data visualization. With enhanced configurability, developers can now customize data binding, axis settings, labels, and legends using dynamic expressions, allowing for more precise and adaptable chart designs. Additionally, seamless migration ensures that existing charts are automatically converted to the new model when older reports are opened in the designer, eliminating the need for manual adjustments. These improvements simplify chart configuration and make it easier to create clear and insightful reports.
To see a full list of what's new in 5.2, see our release notes.
ActiveReportsJS is licensed on an annual subscription or perpetual basis and is available as a Single Deployment License for non-commercial use, and as a Single Domain License or Unlimited Domain License for commercial and/or SaaS use. See our ActiveReportsJS licensing page for full details.
Learn more on our ActiveReportsJS product page.
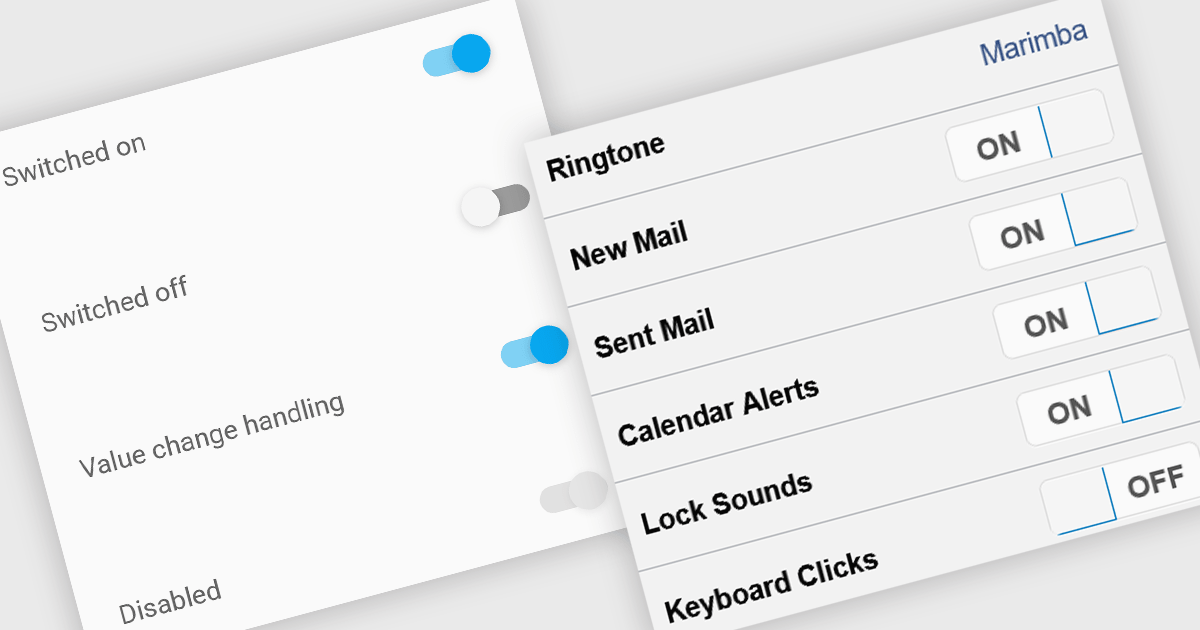
Toggle switches in data editor components provide a user-friendly way to manage boolean values, offering a clear on/off representation that enhances usability. These switches replace traditional checkboxes with a more modern and intuitive interface, making them particularly useful for mobile and web applications where quick interactions are essential. By improving clarity and reducing user errors, toggle switches contribute to a smoother and more efficient data entry experience.
Several Vue.js data editor collections offer toggle switch controls including:
For an in-depth analysis of features and price, visit our Vue.js data editors comparison.
Highcharts is a JavaScript charting framework that allows web developers and data analysts to generate dynamic, visually appealing charts and graphs for websites and web applications. It can display a variety of chart types, including line, spline, area, column, bar, pie, scatter, and many more. Highcharts is well-known for its ease of use, rich documentation, and ability to handle huge datasets efficiently. Features include responsive design, accessibility support, and cross-browser compatibility. Its customization capabilities allow users to create bespoke data visualizations that increase engagement and provide insightful data presentations.
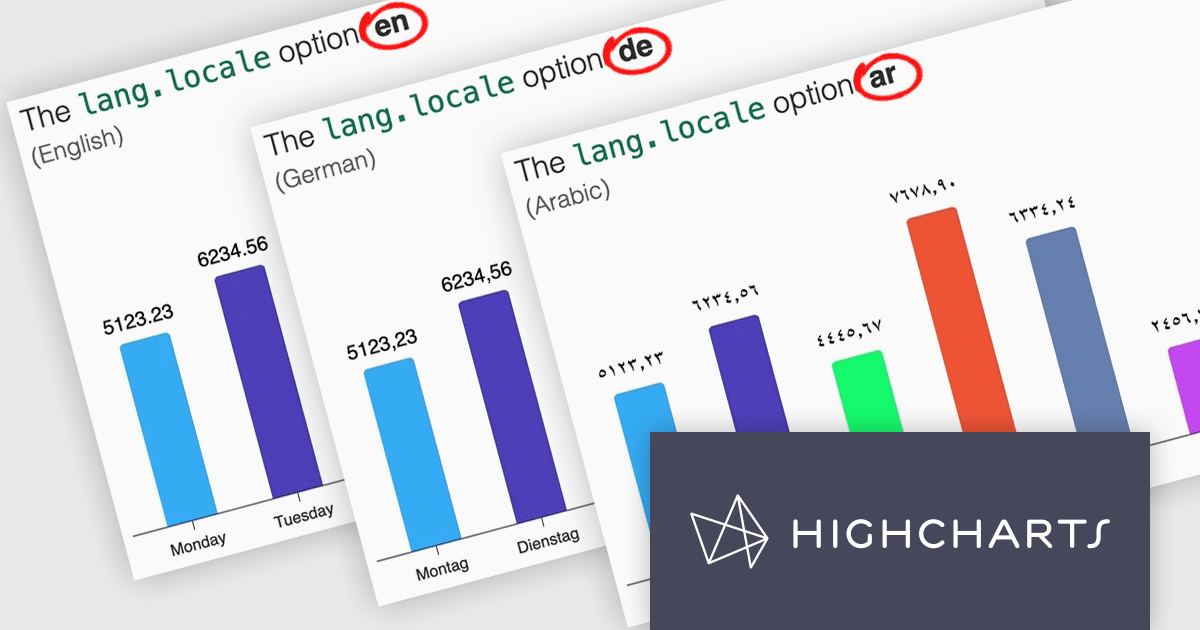
Highcharts v12 introduces the lang.locale option, enabling locale-aware formatting for dates and numbers in charts. This option allows you to define the locale for all charts on a page or set it individually per chart. If no locale is specified, the chart automatically defaults to the page’s or browser’s language settings. Utilizing the browser’s Intl object, lang.locale ensures that dates and numbers are formatted correctly, not only replacing elements like month and weekday names but also structuring entire date expressions according to the selected locale. For instance, American English (en-US) formats a date as January 1, 2025, while British English (en-GB) displays it as 1 January 2025.
To see a full list of what's new in v12, see our release notes.
Highcharts Core is licensed on an annual or perpetual basis, OEM licenses, and Advantage Renewals. It is licensed per Developer and has several license options including Internal, SaaS, SaaS+, and Self Hosted. See our Highcharts Core licensing page for full details.
Learn more on our Highcharts Core product page.
Tel: (888) 850 9911
Fax: +1 770 250 6199


