













Proveedor oficial
Como distribuidores oficiales y autorizados, le suministramos licencias legítimas directamente de más de 200 editores de software.
Ver todas nuestras marcas.
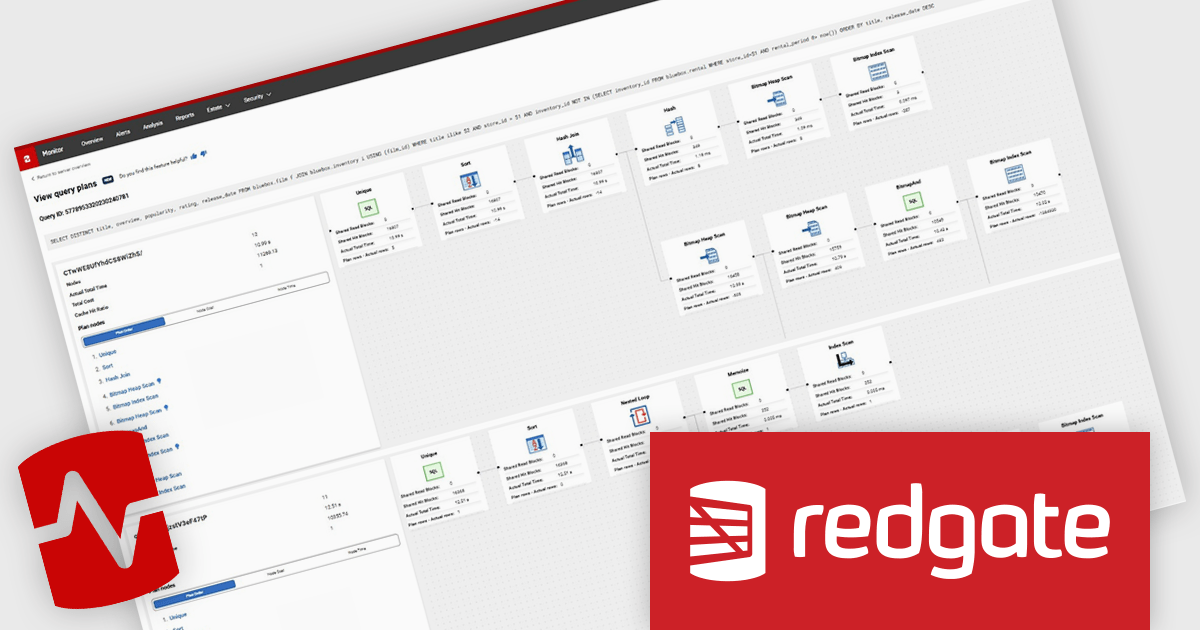
Redgate Monitor (formerly known as SQL Monitor) is a database monitoring tool that helps users quickly identify and fix performance problems on a variety of platforms, including SQL Server and PostgreSQL. It provides real-time monitoring, alerting, root cause analysis, and performance tuning recommendations. Redgate Monitor can be used by DBAs, developers, and operations teams to improve the performance of their databases.
The Redgate Monitor v14.14.0 update introduces Query Plan Comparison for PostgreSQL, enabling developers to analyze execution plans side-by-side and identify changes that impact query performance. By providing clear visibility into differences in cost, execution time, and plan structure, the feature helps isolate the root cause of regressions more efficiently. It also allows teams to correlate plan changes with performance trends over time, improving understanding of how database behavior evolves.
To see a full list of what's new in v14.14.0 see our release notes.
Redgate Monitor is licensed per server on an annual subscription basis. Each Server License will enable you to monitor either 1 Server (Multiple instances), 5 Azure SQL Databases, 1 Cloud (PaaS) instance, or 1 Cluster node. See our Redgate Monitor licensing page for full details.
For more information, visit our Redgate Monitor product page.
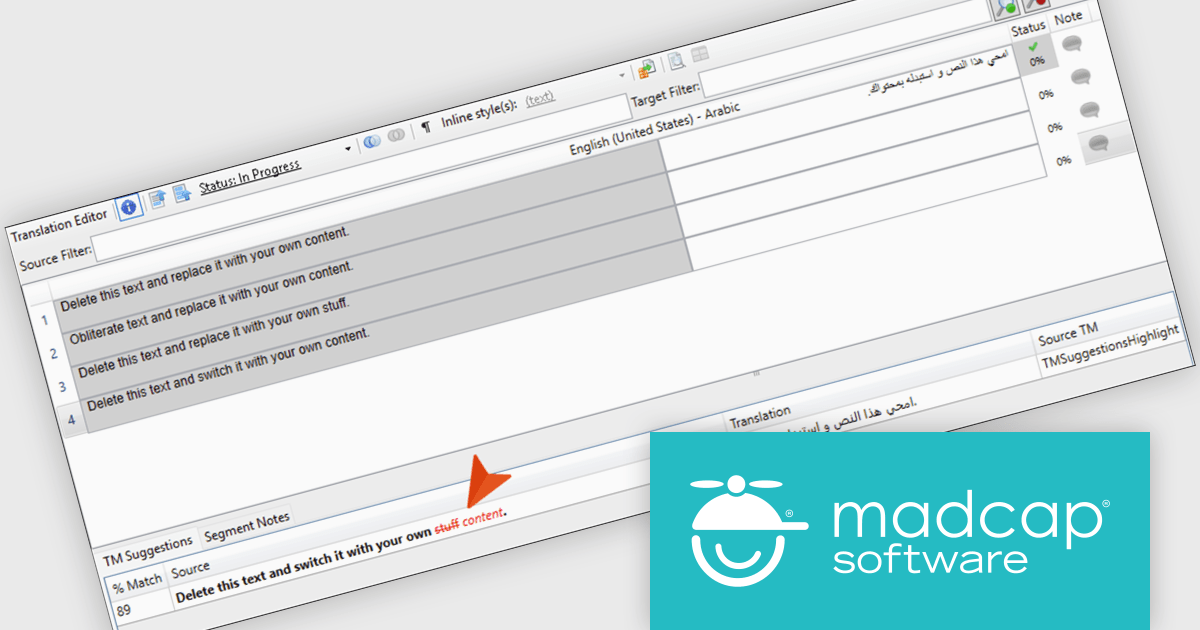
MadCap Lingo is a translation management solution that helps technical writers, documentation specialists and professional translators streamline the translation and localization process. It improves efficiency through built in Translation Memory technology with TMX support, enabling reuse of existing translations and ensuring consistency across projects. With features such as content alignment, termbase management and detailed reporting, it supports accurate translations while reducing manual effort. MadCap Lingo is ideal for managing multilingual documentation, software localization and ongoing content updates.
The MadCap Lingo v12 update introduces Translation Memory suggestion highlights, which improves translation efficiency and accuracy by clearly identifying differences between translation memory matches. By visually distinguishing unchanged text from removed and newly added content, developers and localization teams can quickly assess updates without manually comparing segments. This reduces review time, minimizes the risk of errors, and supports more consistent translations across projects, making it particularly valuable for workflows that involve frequent content updates or iterative localization cycles.
To see a full list of what's new in version 12, see our release notes.
MadCap Lingo is licensed per user and is available as an annual license with support and maintenance. See our MadCap Lingo licensing page for full details.
For more information, see our MadCap Lingo product page.
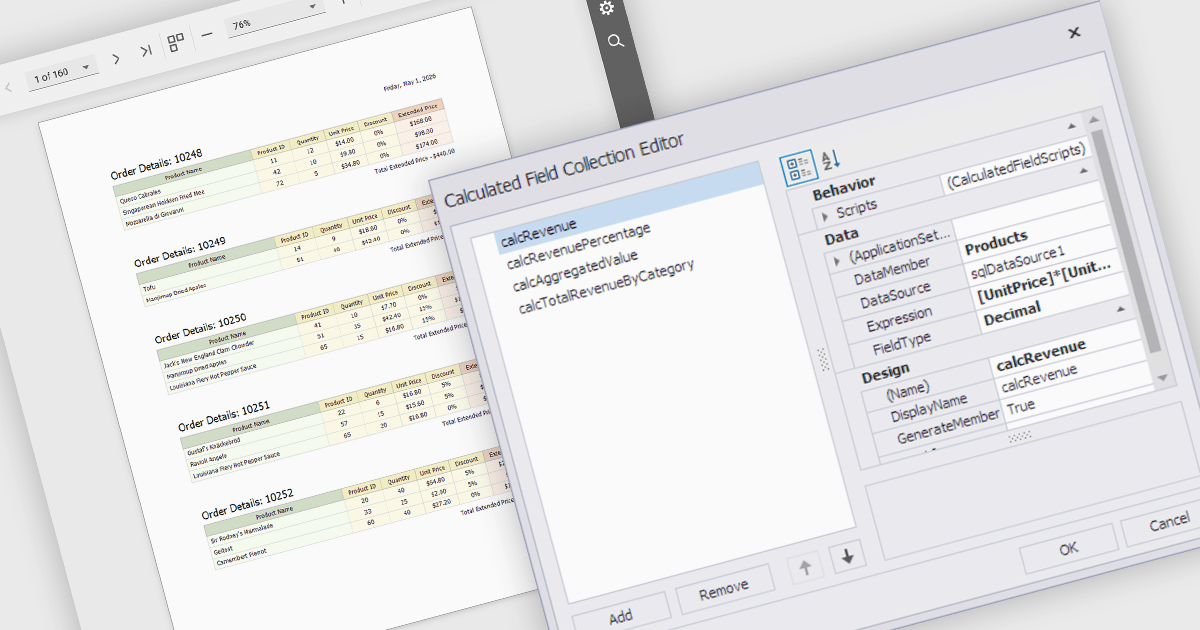
Calculated fields are dynamic values derived from existing data within reporting components. They enable complex data manipulations, calculations, and transformations, providing enhanced data analysis capabilities. By creating new fields based on existing data, calculated fields offer flexibility and efficiency, allowing users to perform calculations, aggregations, and logical comparisons directly within the report. This empowers users to generate insights, visualize trends, and make data-driven decisions without requiring modifications to the underlying data source, ultimately improving report accuracy and usability.
Several React reporting controls offer support for calculated fields:
For an in-depth analysis of features and price, visit our React reporting controls comparison.
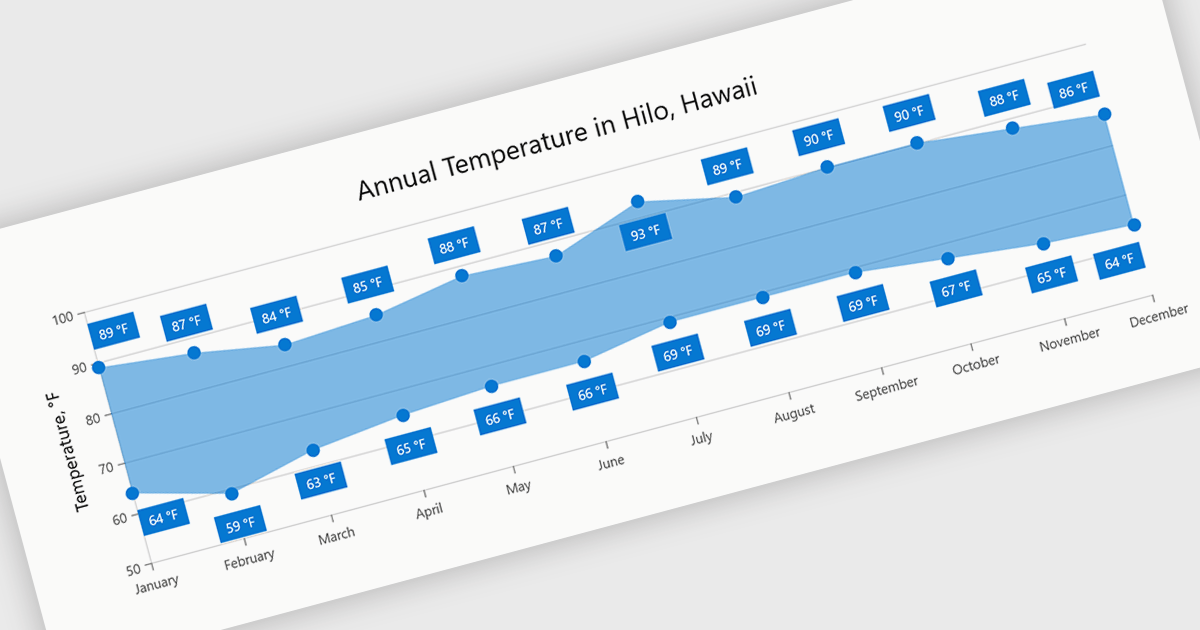
Range charts visualize the difference between minimum and maximum values for each data point using a filled area to represent variation. This makes it easier to understand fluctuations, compare ranges and identify patterns without the clutter of multiple lines. By focusing on value distribution rather than individual points, they improve readability and highlight trends and inconsistencies at a glance. They are useful for scenarios such as tracking temperature ranges, monitoring performance thresholds or comparing variations across datasets.
Several .NET Blazor charting components provide you with range charts, including:
For an in-depth analysis of features and price, visit our .NET Blazor chart controls comparison.
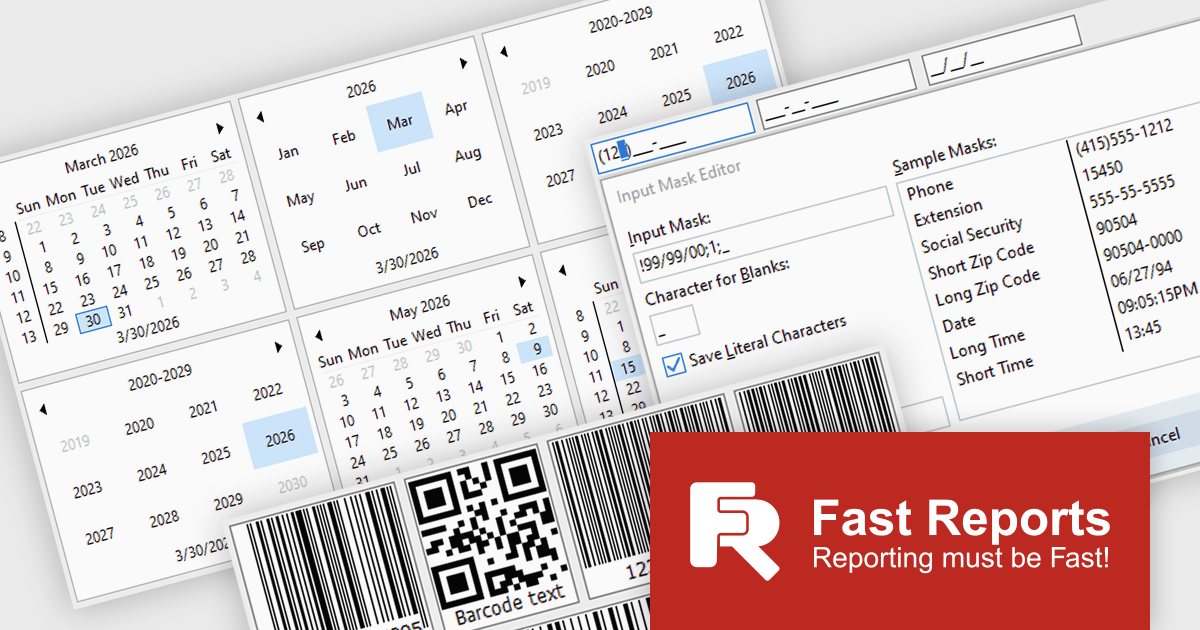
FastReport VCL Reporting Lazarus is a powerful reporting solution for the Lazarus IDE built on Free Pascal, enabling developers to design and generate rich, band oriented reports for Windows and Linux applications. It provides a visual report designer with support for text, images, tables, and scripting in multiple languages, allowing the creation of diverse report types such as invoices, catalogs, and business forms. With integrated data handling, export to widely used formats, and full source code access, it offers extensive customization and flexibility. Its cross platform compatibility, multi language support, and seamless alignment with FastReport VCL make it an efficient choice for developers building scalable, data driven applications.
The latest FastReport VCL Reporting Lazarus release introduces new UI editor components that enhance application development by providing more advanced input controls and extended customization beyond standard components. This enables developers to implement richer user interfaces with built in support for features such as barcode generation, masked input, and currency handling, reducing the need for custom development and third party libraries.
FastReport VCL Reporting Lazarus is licensed per named user and is available as a Perpetual license with 1 year of technical support and product updates. See our FastReport VCL Reporting Lazarus licensing page for full details.
Learn more on our FastReport VCL Reporting Lazarus product page.
Tel: (888) 850 9911
Fax: +1 770 250 6199


