


Proveedor oficial
Como distribuidores oficiales y autorizados, le suministramos licencias legítimas directamente de más de 200 editores de software.
Ver todas nuestras marcas.

PyCharm by JetBrains is a comprehensive integrated development environment (IDE) designed specifically for Python developers. It offers a wide range of features that enhance the Python development experience, including code completion, debugging, and version control integration. PyCharm also provides specialized features for web development with Django, including project templates, templates debugging, and server integration.
The PyCharm 2023.3.3 update introduces a visual diff view for Jupyter notebooks that presents changes within the familiar notebook interface. This simplifies conflict resolution and change comprehension, saving valuable time and effort when working collaboratively.
To see a full list of what's new in version 2023.3.3, see our release notes.
PyCharm is licensed per user, and is available as a commercial annual subscription license. We can supply new subscriptions, subscription renewals (including continuity discounts), lapsed subscription renewals, and additional user licenses. See our PyCharm licensing page for full details.
For more information, visit our PyCharm product page.

We are pleased to announce our new .NET PDF Viewer Components Comparison. This comprehensive tool is designed help developers and programmers select the most suitable PDF viewer component for their specific requirements.
PDF viewer components seamlessly integrate PDF functionality within your application or website, eliminating the need for users to download separate readers. This enhances convenience, improves workflow efficiency, and grants users direct access to PDF content within various digital contexts.
Our unique comparison lets you easily compare 35+ options, showcasing key features, language support, and framework compatibility in a clear side-by-side format. We've meticulously verified over 125 features and 4,500 data points directly with publishers. Gain an in-depth understanding of each viewer's capabilities, compatibility, and pricing, enabling you to make an informed decision tailored to your project's unique needs and preferences.
Many popular standalone PDF viewer components are available, including:
A number of multi-function product suites also offer PDF viewer components, including:
For an in-depth analysis of features and price, visit our complete comparison.
The .NET framework has become a cornerstone of the modern software ecosystem, as it provides a robust and versatile platform for developing a multitude of applications. With every new iteration, .NET brings a range of enhancements, making its adoption increasingly appealing to developers worldwide.
Launched in November 2023, .NET 8 includes a plethora of new features designed to streamline the development process and elevate the integrity of applications. This major release represents a significant step forward, embracing modern development paradigms and equipping software engineers with cutting-edge tools. From the adoption of more efficient methodologies like minimal APIs and Blazor, to profound under-the-hood changes, .NET 8 caters to the current and future needs of developers.
At ComponentSource, we've seen a surge in .NET 8 adoption, with numerous publishers updating their products to ensure compatibility with the new framework, including DevExpress, MESCIUS, Text Control, /n software, Aspose, and Telerik. We've added .NET 8 comparisons for many of our most popular categories, so you can easily compare products that support the latest release. See our Product Comparison page for more information.
The rapid adoption of .NET 8 is a testament to its innovative features and performance improvements. As more developers embrace this powerful framework, the demand for compatible components and libraries is surging. At ComponentSource, we're committed to providing you with the widest selection of .NET 8-ready solutions to fuel your development projects. Explore our extensive catalog of .NET compatible products today and discover the perfect tools to empower your applications.
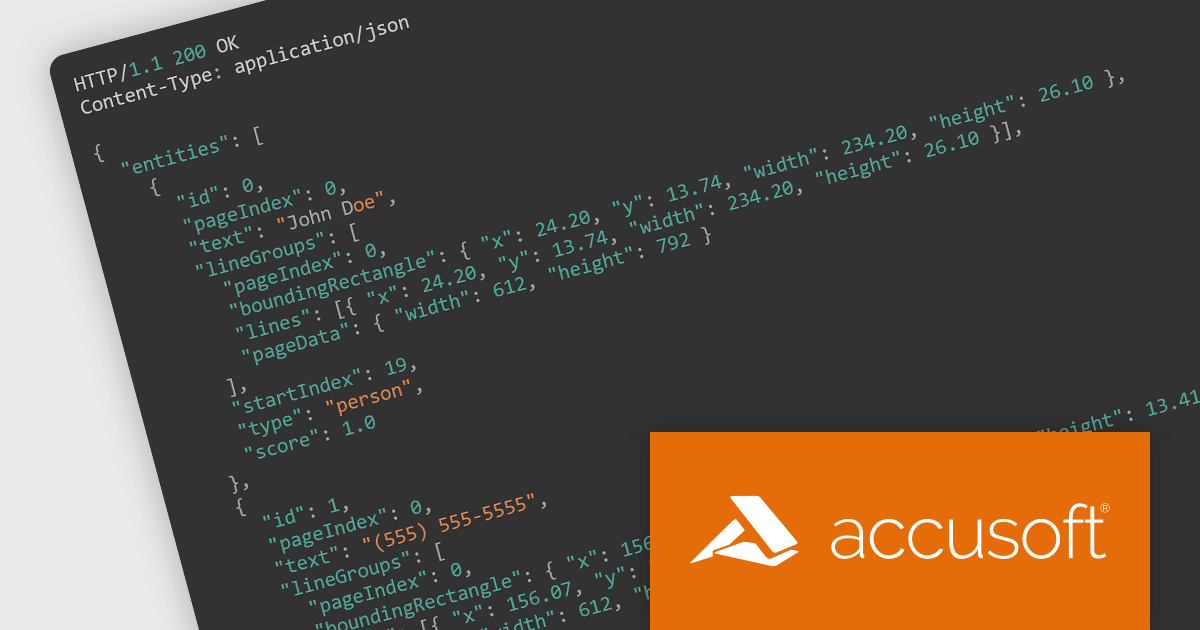
PrizmDoc Viewer by Accusoft is a web-based document viewing and conversion tool that empowers developers to seamlessly integrate document processing functionalities into their applications. Supporting a wide range of file formats, it allows users to view, search, annotate, and even convert documents directly in their browser, eliminating the need for additional software installations. With features like high-fidelity rendering, large document handling, and collaboration options, PrizmDoc Viewer streamlines document management within web applications, enhancing user experience and developer efficiency.
PrizmDoc Viewer v13.26 introduces PII Detectors REST APIs to allow you to perform Personally Identifiable Information (PII) detection. Many countries and regions have laws and regulations in place that govern how organizations can collect, store, and use PII. By detecting and managing PII within your documents you can help ensure that you are complying with these regulations and avoiding potential fines or penalties.
To see a full list of what’s new in version 13.26, see our release notes.
PrizmDoc Viewer is available as Self-Hosted, Cloud-Hosted or Private Cloud-Hosted deployments. Billed on an annual subscription basis, you will need to renew your license each year to continue to use the software. The price is based on the number of servers or the number of transactions you require, depending on your deployment method. See our PrizmDoc Viewer licensing page for full details.
For more information, see our PrizmDoc Viewer product page.
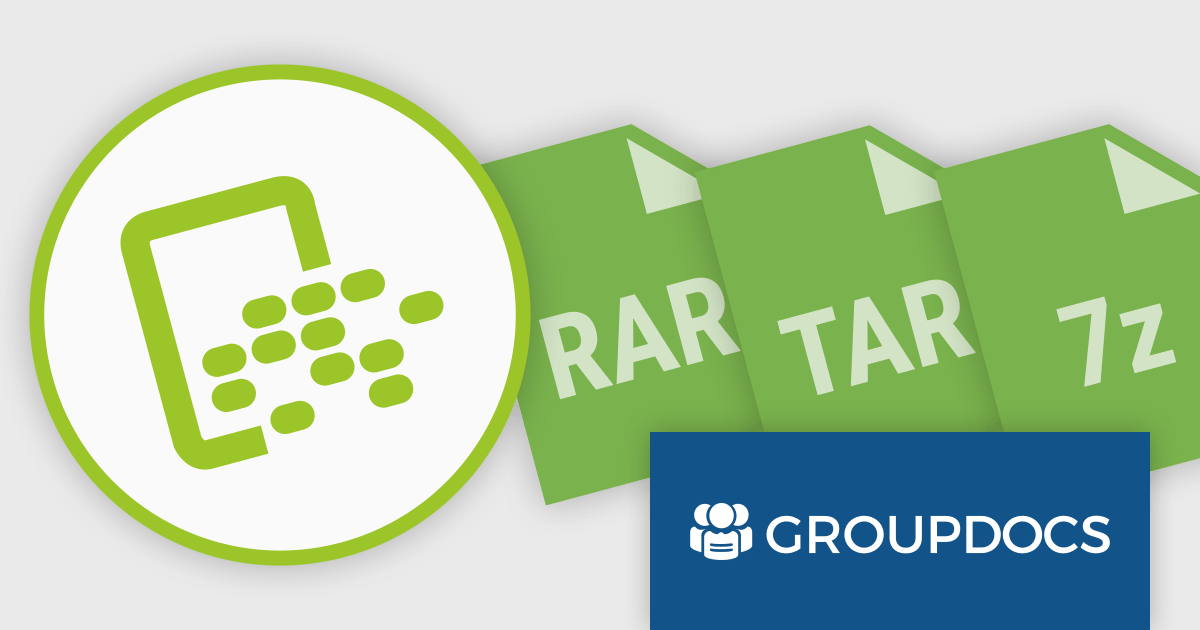
GroupDocs.Metadata for .NET is a powerful API that grants developers granular control over the hidden information within various document formats, like Word, Excel, PDFs, and even images and audio. It seamlessly enables reading, editing, and removal of metadata properties, empowering you to organize, categorize, and extract valuable insights from your file collection with ease. This metadata manipulation capability unlocks enhanced document searchability, automated classification, and streamlined information retrieval, boosting the efficiency and organization of your data ecosystem.
The 24.1 release of GroupDocs.Metadata for .NET adds support for .rar, .tar and .7z formats. This allows your applications to read, edit and remove metadata associated with archive files, enabling advanced search, content classification, automated metadata processing, and improved archive organization.
To see a full list of what's new in version 24.1, see our release notes.
GroupDocs.Metadata for .NET is offered as Developer Small Business, Developer OEM, Site Small Business, and Site OEM licenses, catering to a range of business needs. Licenses are perpetual, and include 1 year of support and maintenance. Subscription renewals are also available. See our GroupDocs.Metadata for .NET licensing page for full details.
GroupDocs.Metadata for .NET is available in the following products:
Tel: (888) 850 9911
Fax: +1 770 250 6199


