


Proveedor oficial
Como distribuidores oficiales y autorizados, le suministramos licencias legítimas directamente de más de 200 editores de software.
Ver todas nuestras marcas.
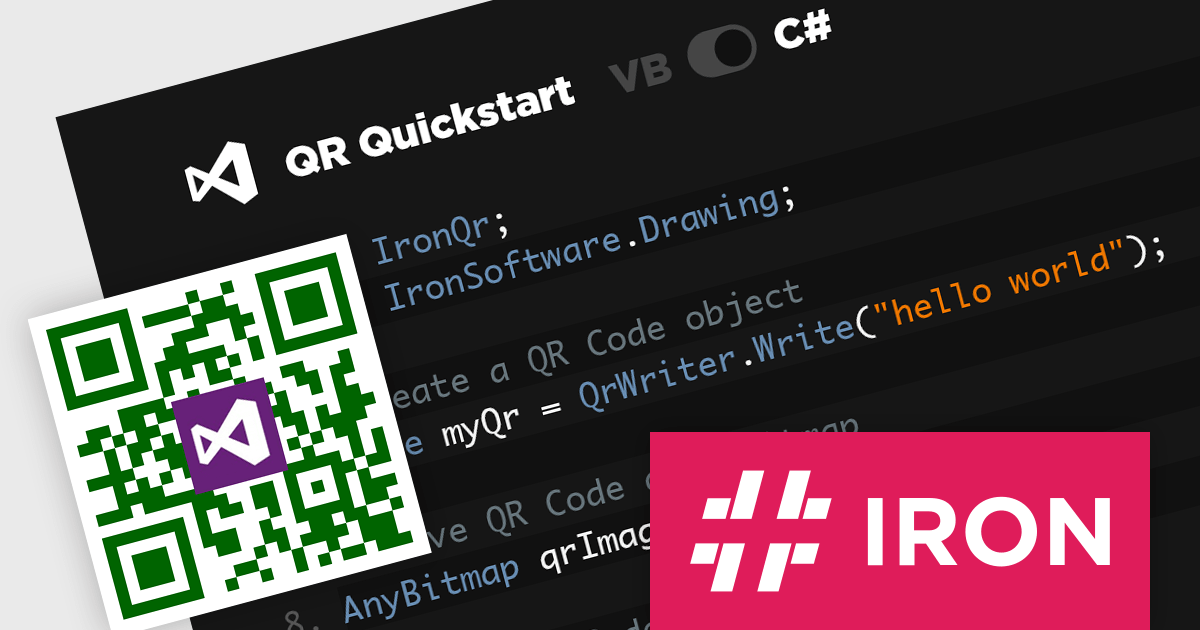
IronQR for .NET by Iron Software is a new C# library specifically designed for .NET developers who want to effortlessly integrate QR code functionality into their applications. Whether you need to generate or read QR codes, IronQR offers a user-friendly API that minimizes coding complexity and streamlines the development process. It offers customization options including the ability to resize, add margins and borders, recolor, and embed logos. Additionally, it provides fault tolerance mechanisms, enabling developers to ensure the reliability of their QR codes by choosing the appropriate QR version, implementing null checking, checksum validation, and error message generation.
IronQR for .NET is licensed per developer and is available as a perpetual license with 1 year of product updates and support services. Lite, Plus and Professional Licenses are available for different development and distribution requirements. See our IronQR for .NET licensing page for full details.
IronQR for .NET is available to buy in the following products:
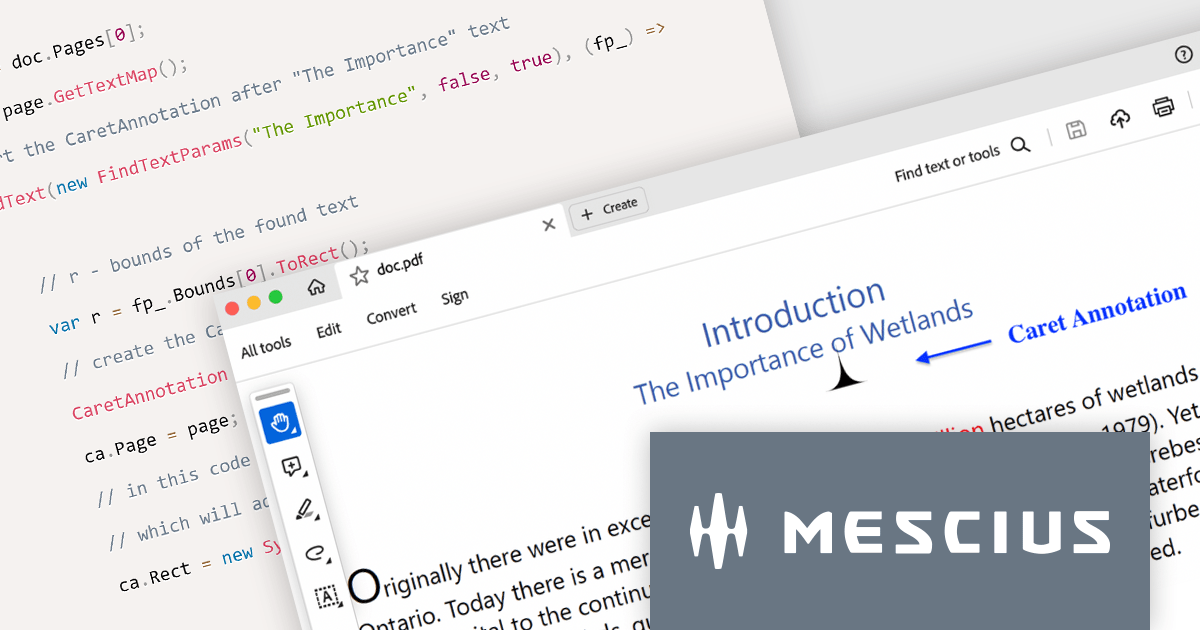
Document Solutions for PDF (formerly GrapeCity Documents for PDF), is a powerful and comprehensive C# library that empowers developers to create, manipulate, and manage PDF documents with ease. This versatile product enables developers to generate PDFs from scratch, modify existing documents, import and export data, and incorporate advanced features like AcroForms and annotations.
Document Solutions for PDF v7 elevates document review with the introduction of Caret Annotation, a useful tool for pinpointing critical areas in PDFs. The CaretAnnotation class empowers you to programmatically identify and highlight missing content or necessary modifications with pinpoint accuracy. This feature facilitates the rapid placement of visual cues across multiple locations within your PDFs, ensuring reviewers can easily identify areas that require attention.
To see a full list of what's new in version 7.0.0, see our release notes.
Document Solutions for PDF is licensed per developer and is available in several license options for differing distribution needs. Team licenses are also available for multiple developers within the same organization. See our Document Solutions for PDF licensing page for full details.
For more information, visit our Document Solutions for PDF product page.
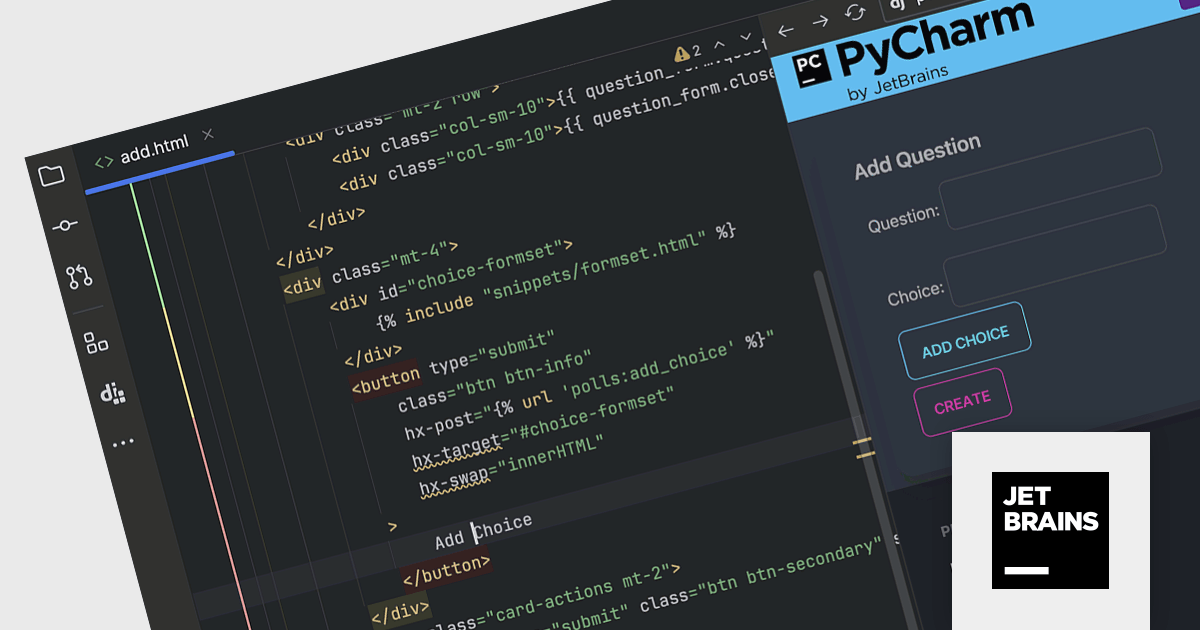
PyCharm by JetBrains is a comprehensive integrated development environment (IDE) designed specifically for Python developers. It offers a wide range of features that enhance the Python development experience, including code completion, debugging, and version control integration. PyCharm also provides specialized features for web development with Django, including project templates, templates debugging, and server integration.
Version 2023.3 introduces a streamlined workflow for editing Django templates with a new live preview feature. Code changes are now instantly reflected in the preview, eliminating the need for manual reloading. The integrated Developer Tools console provides convenient troubleshooting capabilities. This intuitive approach makes it quick and easy to polish your Django templates.
To see a full list of what's new in version 2023.3, see our release notes.
PyCharm is licensed per user, and is available as a commercial annual subscription license. We can supply new subscriptions, subscription renewals (including continuity discounts), lapsed subscription renewals, and additional user licenses. See our PyCharm licensing page for full details.
For more information, visit our PyCharm product page.
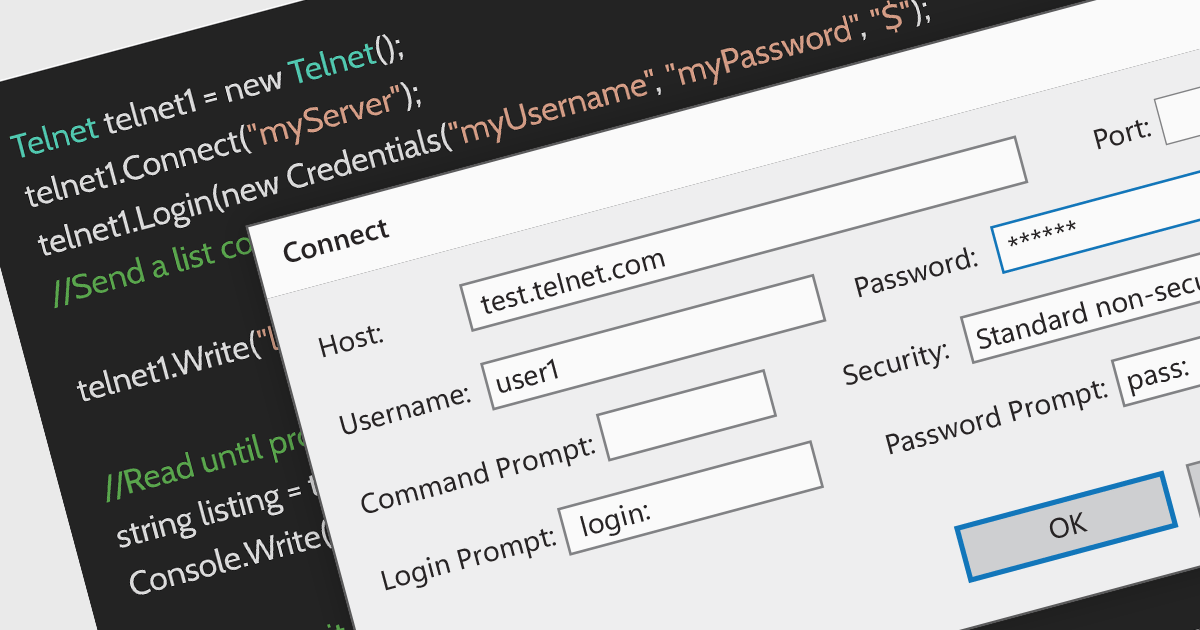
Telnet is a network protocol used to provide bidirectional interactive text-oriented communication facility using a virtual terminal connection over TCP. Within communications and messaging, Telnet is used for accessing remote servers and devices, allowing users to manage networks and perform system administration tasks remotely.
Several .NET Communications and Messaging components provide Telnet support including:
For an in-depth analysis of features and price, visit our .NET Communications and Messaging Component comparison.

Drill-down charts are a type of interactive data visualization that allow users to explore hierarchical data by navigating multiple levels of detail. This makes them a powerful tool for analyzing complex data sets and uncovering hidden insights. By clicking on specific segments or elements within a chart, users can dynamically descend through the hierarchy, revealing granular details at each level. This process of zooming into specific data points empowers users to gain a deeper understanding of the overall trends and relationships within the dataset. Drill-down charts are particularly well-suited for analyzing sales figures, customer segmentation, and comparative performance metrics. Their ability to present data at multiple scales caters to users with diverse levels of data expertise, making them an accessible tool for data exploration and analysis.
Several Angular charting components provide drill down support including:
For an in-depth analysis of features and price, visit our Angular Chart comparison.
Tel: (888) 850 9911
Fax: +1 770 250 6199


