


Proveedor oficial
Como distribuidores oficiales y autorizados, le suministramos licencias legítimas directamente de más de 200 editores de software.
Ver todas nuestras marcas.
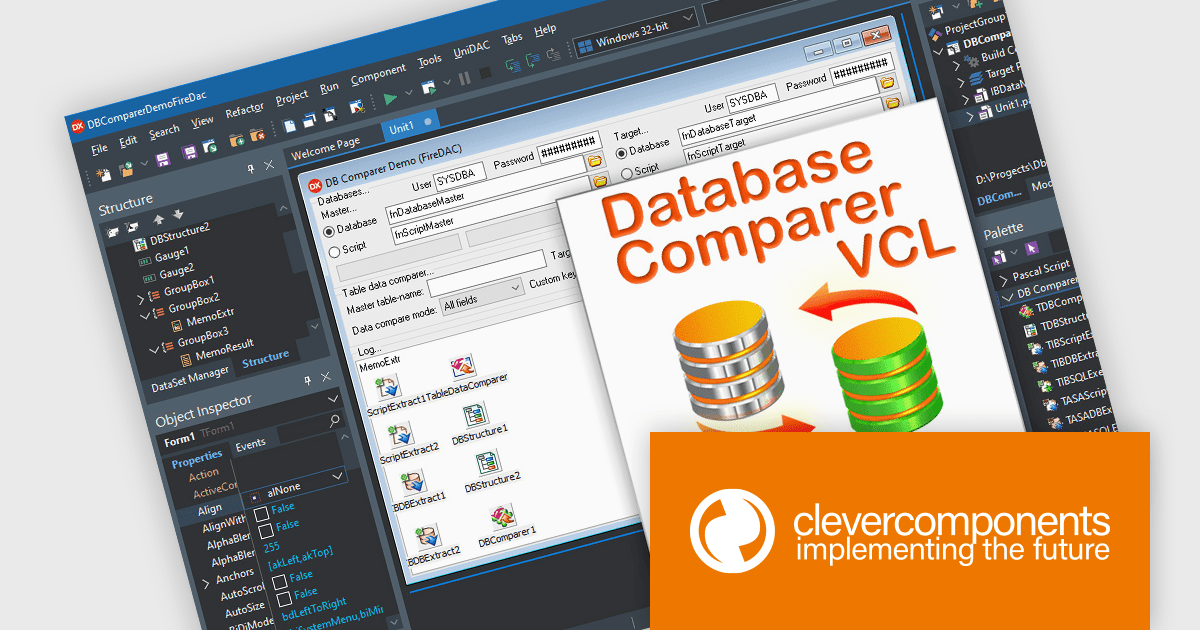
Database Comparer VCL is a library of Delphi and C++Builder components that efficiently compare and synchronize database structures and data across various popular databases like MySQL, SQL Server, and Oracle. It lets you visualize differences, generate synchronization scripts, and update target databases, offering developers a powerful tool for database version control, deployment, and data migration.
The latest release of Database Comparer VCL for Delphi, C++Builder has added support for Embarcadero RAD Studio 13 Florence. This brings developers the advantages of the latest compiler updates, IDE refinements, and platform improvements offered by Embarcadero's newest release. Database Comparer VCL can now take full advantage of better performance, greater stability, and improved compatibility with modern development standards.
Database Comparer VCL for Delphi, C++Builder is licensed per developer and is available as a perpetual license with one year of updates. Update licenses are available to extend the update period for a further year. See our Database Comparer VCL for Delphi, C++Builder licensing page for full details.
Database Comparer VCL for Delphi, C++Builder is available individually or as part of the following products:
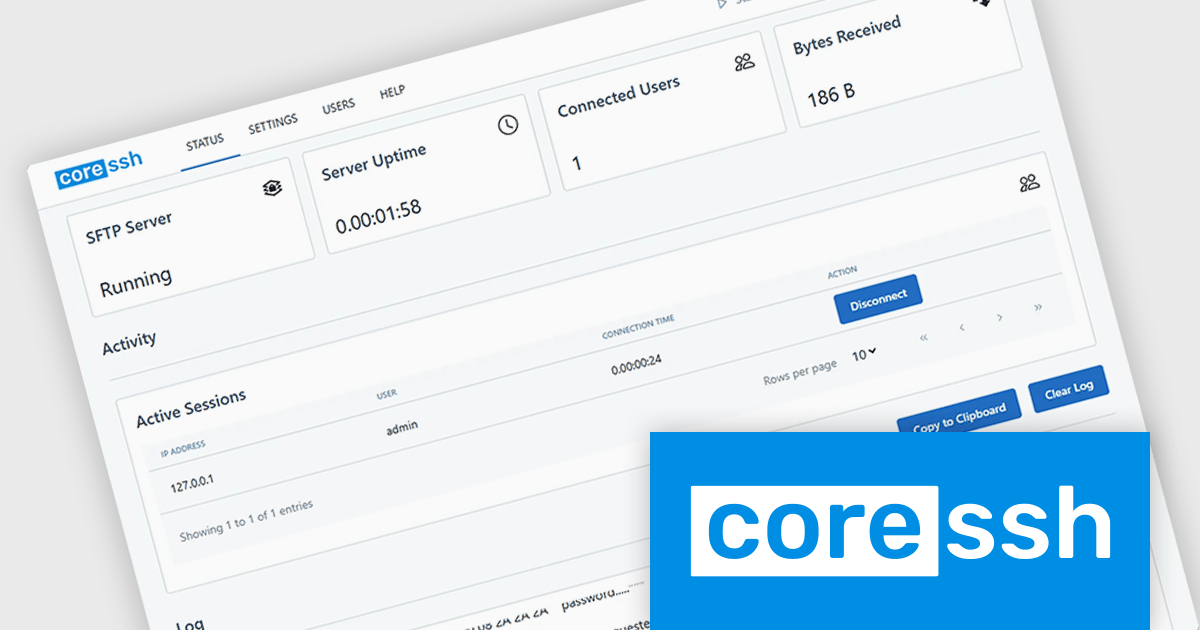
CoreSSH Server is a secure shell (SSH) and file transfer server designed to enable encrypted remote access and data movement without requiring extensive initial setup. It implements secure protocols such as SSH and the SSH File Transfer Protocol (SFTP) to protect data in transit and provides support for common authentication methods like passwords, public keys, and multi‑factor authentication. The server runs on multiple platforms including Windows, macOS, and Linux and includes a browser‑based administration interface for configuring users, monitoring sessions, and managing connections. Its architecture is built in managed code on the .NET framework with modern cryptographic standards to address performance and security needs without relying on external open‑source libraries.
In practical use, CoreSSH Server can function as a central point for secure file exchange in environments where encrypted transfers are a requirement, such as between development, test and production systems or with external partners accessing resources remotely. It also supports interactive SSH shell sessions and remote command execution, which can be useful for administering servers, running scripts, or managing systems over secure connections without a separate remote desktop solution. Organizations can integrate its authentication with existing infrastructure like Active Directory and enforce access controls, or use it as part of automated processes for backups and deployment pipelines that need secure copy (SCP) or SFTP transfers.
CoreSSH Server is licensed per server and is available as both perpetual and annual subscription based licenses. See our CoreSSH Server licensing page for full details.
For more information, see our CoreSSH Server product page.
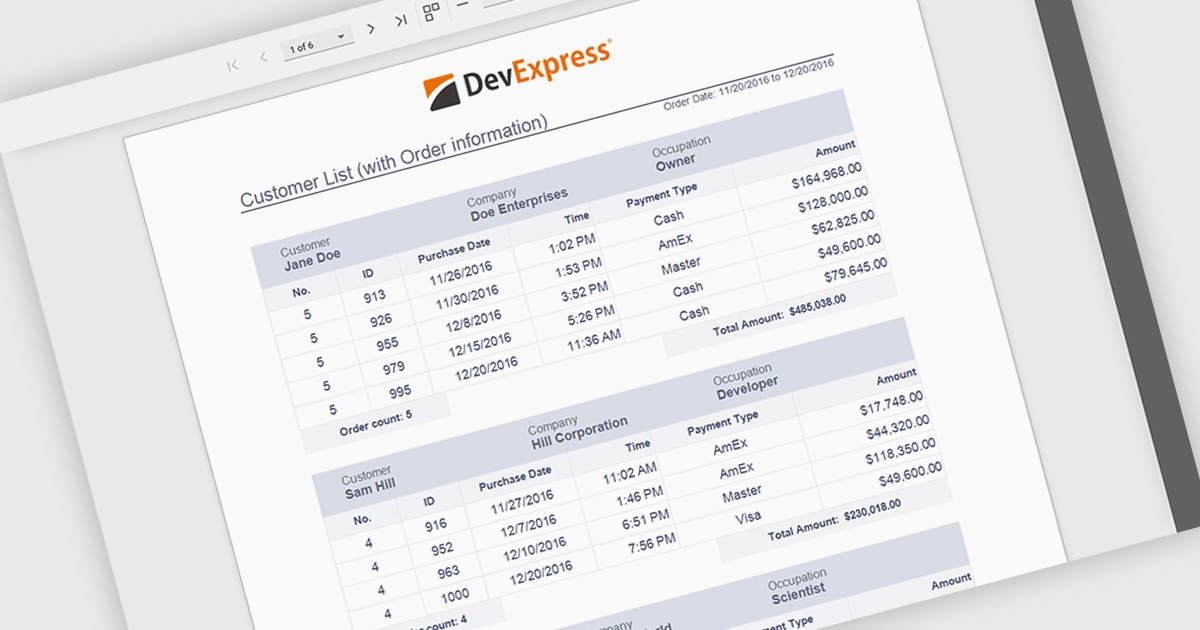
Subreports allow independently maintained reports to be embedded within a master report, enabling a modular and flexible reporting design. Each Subreport can be created, maintained, and reused separately, while connecting to the master report through parameters that dynamically filter its data from a separate data source. This approach simplifies complex reporting scenarios, improves consistency, and reduces maintenance effort by avoiding duplicated logic. Common use cases include displaying detailed line items within summary reports, combining data from multiple databases, or reusing standardized sections such as invoices, audit details, or customer histories across multiple reports.
Several ASP.NET Core reporting controls offer support for subreports including:
For an in-depth analysis of features and price, visit our ASP.NET Core reporting controls comparison.
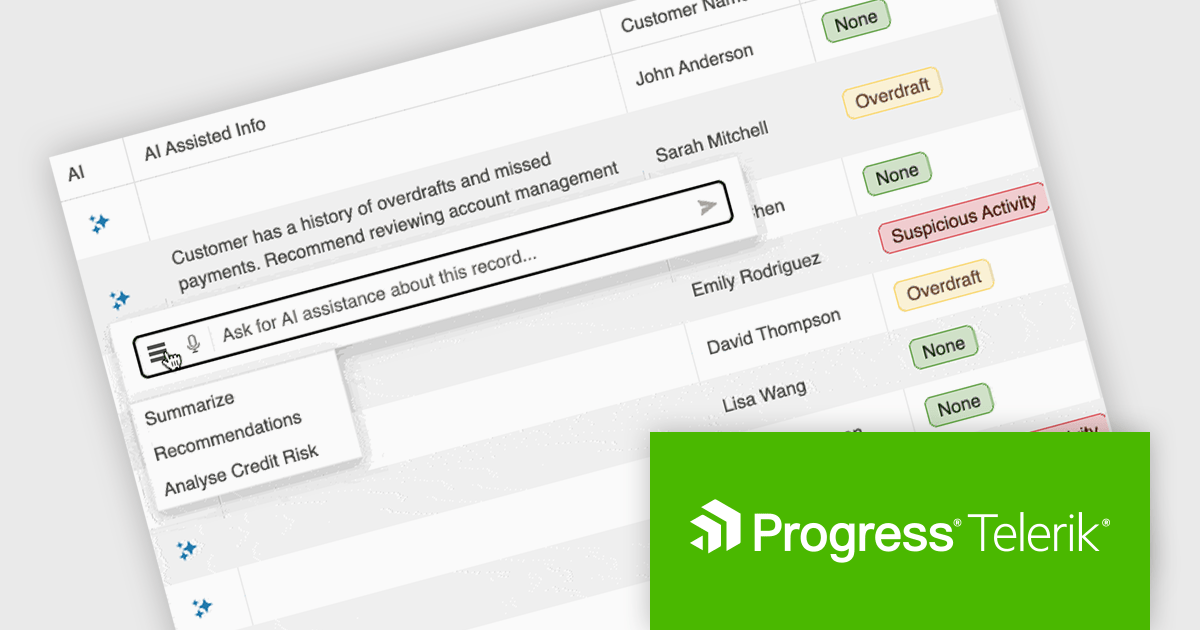
KendoReact by Telerik is a comprehensive library of UI components designed for building modern, feature-rich React applications, enabling developers to create intuitive, responsive, and visually appealing interfaces with ease. It includes robust components like data grids, charts, form elements, and navigation tools, optimized for high performance with features such as virtualization for large datasets and adherence to accessibility standards. Ideal for dashboards, enterprise apps, and data-driven applications, KendoReact empowers teams to accelerate development, ensure design consistency, and deliver inclusive user experiences.
KendoReact provides software developers with a Smart AI Data Grid that allows end users to interact with application data using natural language or voice prompts to filter, group, sort, and analyze information in real time. This reduces the need for complex custom UI controls and lowers the learning curve for end users, while still leveraging the full power of the grid. By embedding conversational interactions and row-level AI analysis directly into the data grid, developers can deliver more efficient, user-friendly data experiences without sacrificing control, predictability, or integration with existing application logic and security requirements.
KendoReact is licensed per developer and has two licensing models: an annual Subscription License and a Perpetual License. The Subscription license provides access to the latest product updates, technical support, and exclusive benefits for a flat annual fee, and must be renewed to continue using the software. The Perpetual license is a one-time purchase granting access to the current released version and includes a one-year subscription for product updates and technical support. After this initial period, users can choose to renew the subscription element to continue receiving updates and support; otherwise, they may continue using the installed version available during their active subscription term but will forgo future updates and support. See our KendoReact licensing page for full details.
KendoReact is available individually or as part of the following products:
Document Solutions for Excel, .NET Edition by MESCIUS is designed to enable developers to create and manipulate Microsoft Excel documents programmatically within .NET applications. It provides a robust API for interacting with Excel spreadsheets, allowing developers to automate tasks such as data extraction, formatting, and generation of reports. The framework offers comprehensive support for various Excel features, including formulas, charts, conditional formatting, and data validation. It also provides tools for handling large datasets and optimizing performance, making it suitable for both small-scale and enterprise-level applications.
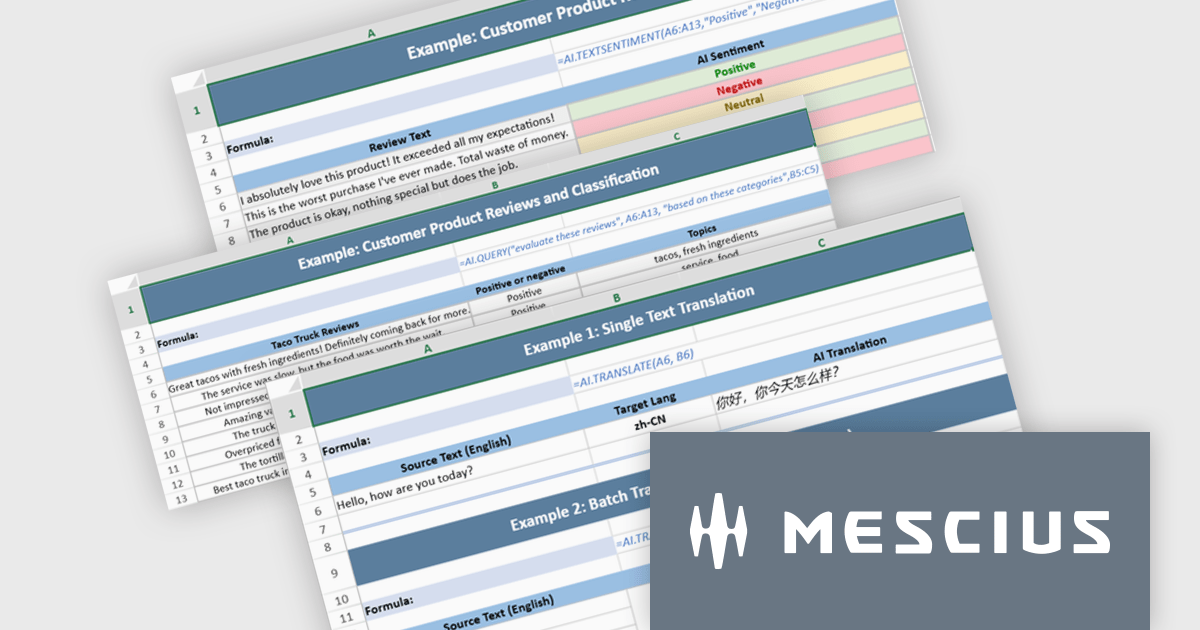
The Document Solutions for Excel, .NET Edition v9.0.0 update introduces a major new capability: AI-powered functions that integrate large language models directly into the spreadsheet formula engine. Developers can now use AI.QUERY to build dynamic prompts from cell values, AI.TRANSLATE to localize ranges into target languages, and AI.TEXTSENTIMENT to classify text as positive, negative, or neutral, all within formula syntax. These functions support both template use and automation scenarios, enabling more intelligent document workflows.
To see a full list of what's new in v9.0.0, see our release notes.
Document Solutions for Excel is licensed per developer and is available in several license options for differing distribution needs. Team licenses are also available for multiple developers within the same organization. See our Document Solutions for Excel, .NET Edition licensing page for full details.
Document Solutions for Excel, .NET Edition is available to buy in the following products:
Tel: (888) 850 9911
Fax: +1 770 250 6199


