













Proveedor oficial
Como distribuidores oficiales y autorizados, le suministramos licencias legítimas directamente de más de 200 editores de software.
Ver todas nuestras marcas.
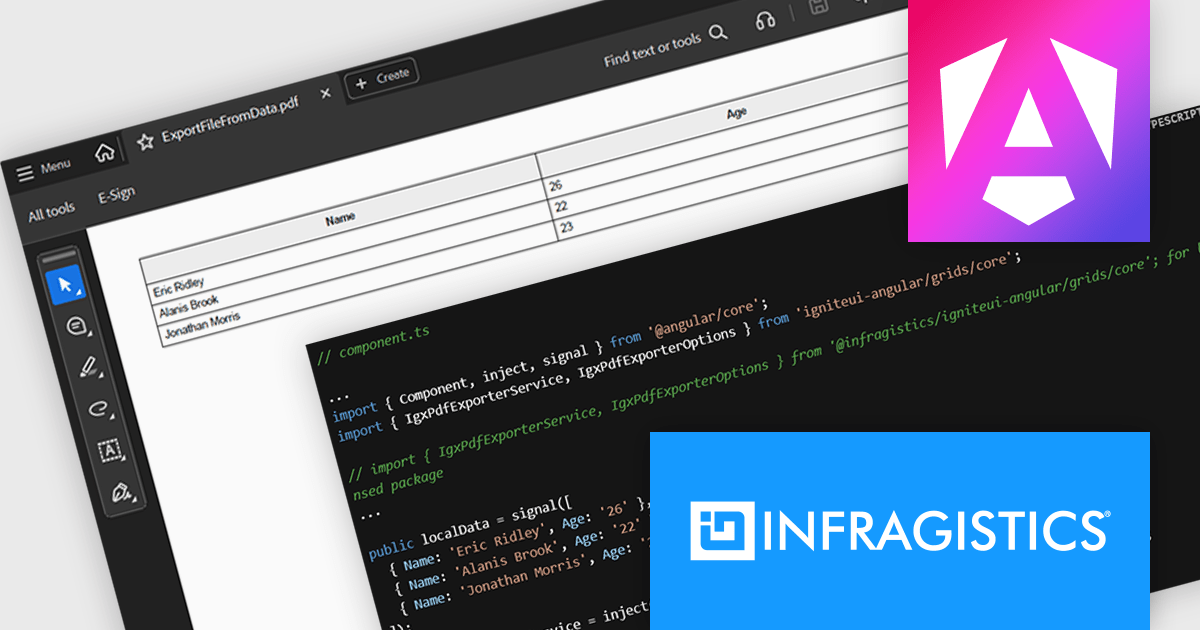
Infragistics Ignite UI for Angular is a comprehensive suite of Angular components and UI controls designed to accelerate development of high-performance, enterprise-grade web applications. It offers a rich collection of data grids, charts, and other UI elements, along with advanced features like pivoting, docking, and hierarchical data management. Built on Angular, the toolkit integrates into existing projects and provides a foundation for building modern, responsive, and interactive user interfaces.
The Ignite UI for Angular 21 release introduces the Grid PDF Exporter, a new service that allows developers to export data directly into PDF format from both raw arrays and advanced Angular grid components like IgxGrid, IgxTreeGrid, IgxHierarchicalGrid, and IgxPivotGrid. It offers a rich set of export capabilities including support for multi-page documents, automatic handling of page breaks, and customization of PDF formatting. Whether you're working with hierarchical data or flat tables, the service provides a structured and flexible solution for generating professional PDF files.
To see a full list of what's new in version 21, see our release notes.
Infragistics Ignite UI for Angular is part of Infragistics Ignite UI which is licensed per developer and is available as a Perpetual License with a 1, 2 or 3 year support and maintenance subscription. See our Infragistics Ignite UI licensing page for full details.
Infragistics Ignite UI for Angular is available in the following products:
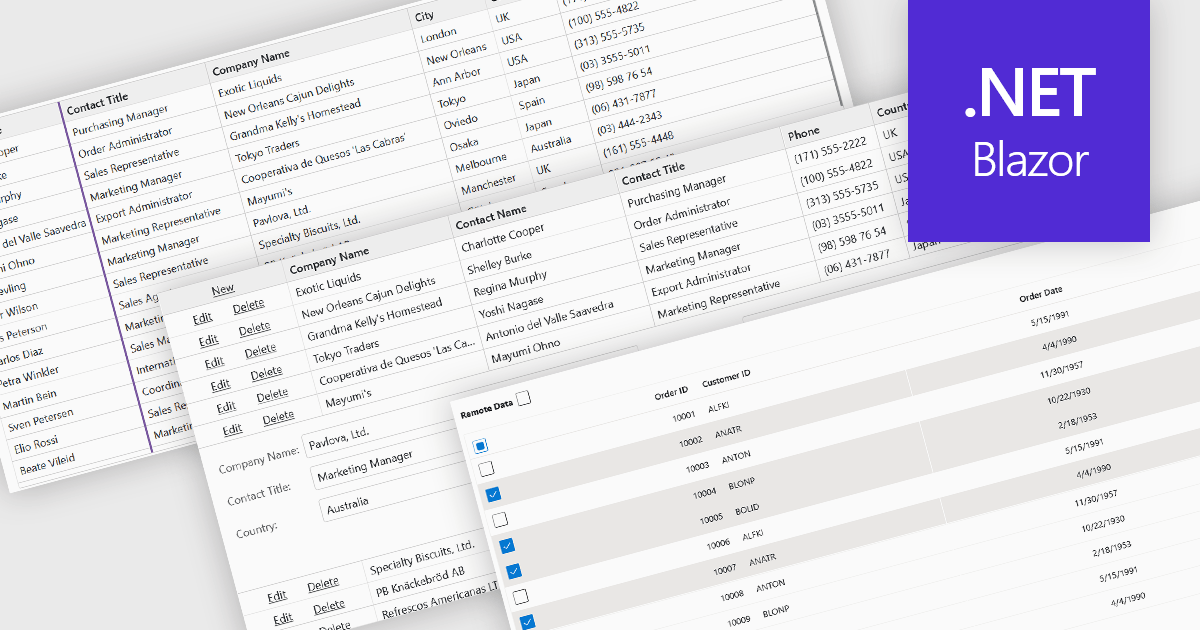
Row and column features form the core of modern grid components, enabling users to view, navigate, and manipulate tabular data efficiently. These capabilities improve usability and help developers present information in a structured, interactive format suited to many types of applications. By offering clear ways to organise, edit, and inspect information, row and column features allow users to work more effectively while maintaining control over how content is displayed.
Common features include:
For an in-depth analysis of features and price, visit our Blazor grid components comparison.
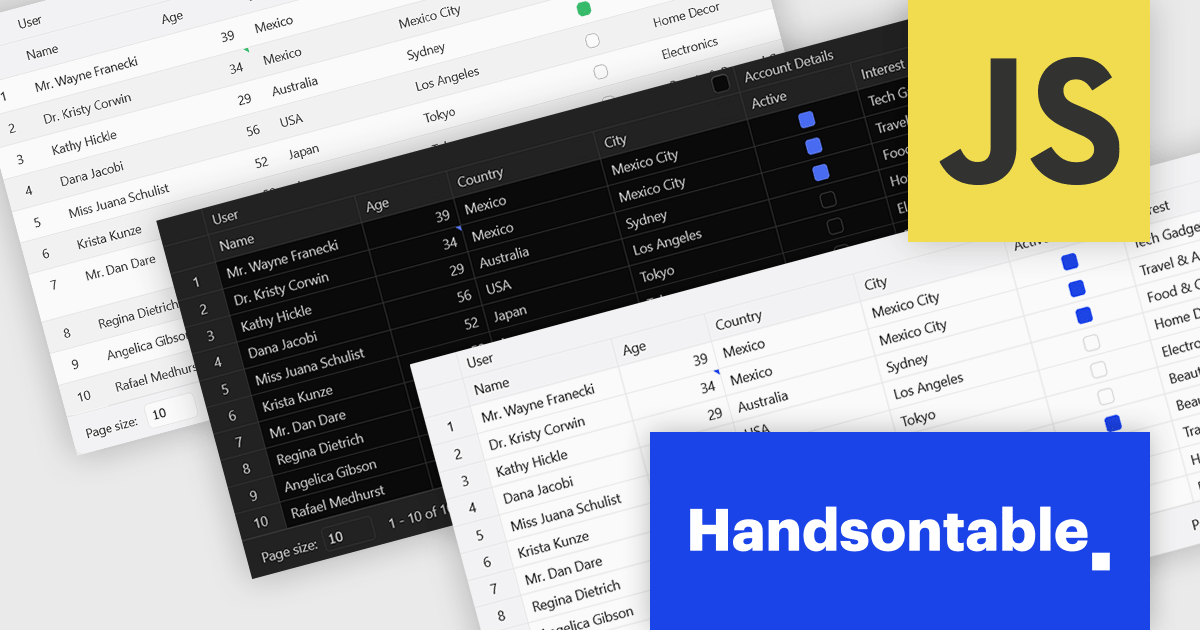
Handsontable is a JavaScript library designed to help developers build interactive data grids into their web applications. Offering a familiar spreadsheet-like interface, it allows users to edit, sort, and filter data with ease. Highly customizable and compatible with popular frameworks like React and Angular, Handsontable empowers developers to build robust data manipulation features into their web applications.
The Handsontable 16.2.0 update introduces a redesigned approach to CSS theming with the addition of an alias-based variable system. This new hierarchy organizes CSS variables into logical layers, separating core values from theme-specific settings. As a result, developers can now apply consistent visual customization across the grid while maintaining clean, manageable stylesheets. This change significantly reduces the guesswork involved in identifying the correct variables and improves maintainability by clearly documenting the relationships between base tokens and theme aliases. It's a notable enhancement for teams looking to build and manage complex, branded UI components with greater efficiency and clarity.
To see a full list of what's new in version 16.2.0, see our release notes.
Handsontable is licensed per developer and is available as an Annual or Perpetual license with 1 year support and maintenance. See our Handsontable licensing page for full details.
For more information, visit our Handsontable product page.
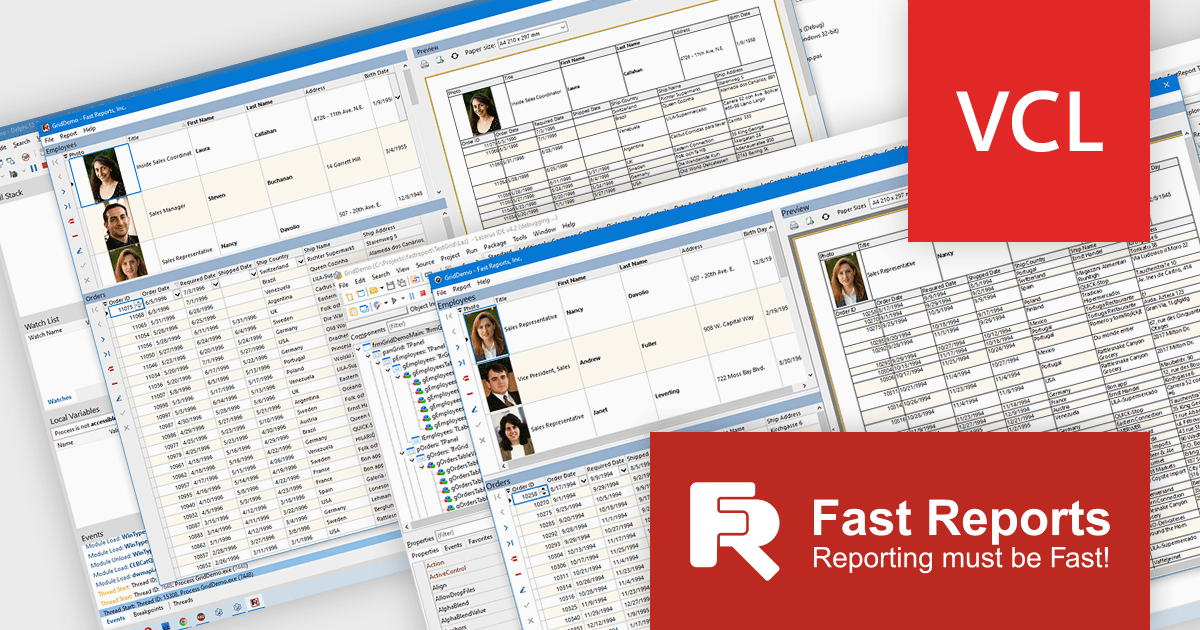
FastGrid is a modern, high-performance grid component designed for VCL and Lazarus environments, now incorporated into the FastReport VCL Ultimate package. It provides developers with an efficient and intuitive way to present, explore, and interact with data using minimal code. By supporting the standard TDataSource interface, FastGrid works easily with a wide range of database access technologies, including FireDAC, ADO, BDE, IBX, Oracle, and more, making it a versatile solution for data-driven applications. Its full compatibility with FastReport VCL also allows users to print and export while retaining all sorting, filtering, and visual settings.
The new FastGrid component introduces a robust set of features that benefit developers working with data grids. It offers built-in filtering and sorting that eliminate the need for custom UI logic, as well as smart editors that automatically adapt to the underlying data type, such as text, numeric values, lists, checkboxes, or even images, to enhance usability and accuracy. FastGrid delivers full WYSIWYG configuration at design time, allowing precise control of columns and interface elements. It is fully integrated with FastReport VCL, enabling printing and exporting to all supported formats while preserving display settings and user-applied filters. With full source code included, developers also gain the flexibility to customize and extend the component to meet specific project requirements.
FastGrid is included in FastReport VCL Ultimate which is licensed per named user and is available as a Perpetual license with 1 year of technical support and product updates. See our FastReport VCL Ultimate licensing page for full details.
Learn more on our FastReport VCL Ultimate product page.
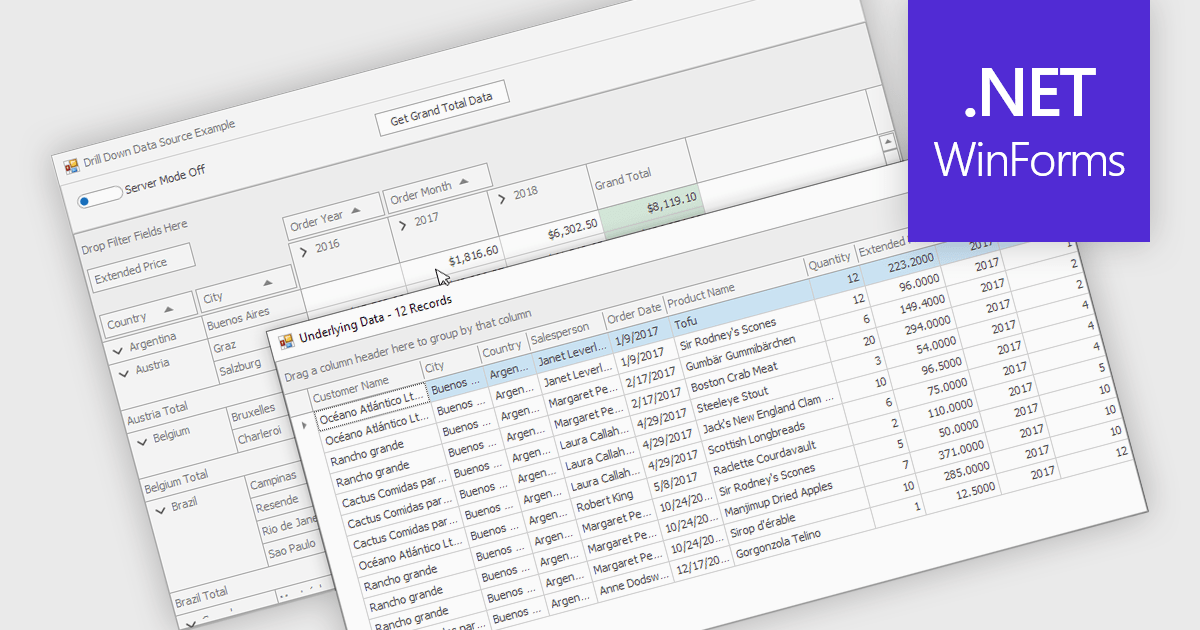
Drill-down capability within a grid control enables users to move from summary data to increasingly detailed records within the same interface, creating a smooth and focused exploration experience. It improves productivity by reducing screen changes and extra queries, helps users spot patterns and exceptions more quickly, and keeps complex information clearly organized. Typical use cases include reviewing sales by region, then by city and customer, analyzing financial summaries that open into individual transactions, or exploring product inventories from category to specific item.
Several .NET WinForms grid controls offer drill-down capability including:
For an in-depth analysis of features and price, visit our .NET WinForms grid controls comparison.
Tel: (888) 850 9911
Fax: +1 770 250 6199


