













Proveedor oficial
Como distribuidores oficiales y autorizados, le suministramos licencias legítimas directamente de más de 200 editores de software.
Ver todas nuestras marcas.
FastReport .NET is a comprehensive reporting solution for .NET applications, offering a wide range of tools for creating, managing, and delivering reports. This software is designed to enable developers to integrate complex reporting functionalities directly into their .NET projects. Key features of FastReport .NET include an intuitive visual report designer, a powerful data processing engine, and support for a variety of export formats such as PDF, Excel, and Word. The product also supports data connectivity from multiple sources, including databases, XML files, and JSON. With its robust scripting capabilities, customizable templates, and ability to generate interactive reports, FastReport .NET provides developers with a versatile toolset for building high-performance, professional-grade reports suitable for business intelligence, data analysis, and presentation needs.
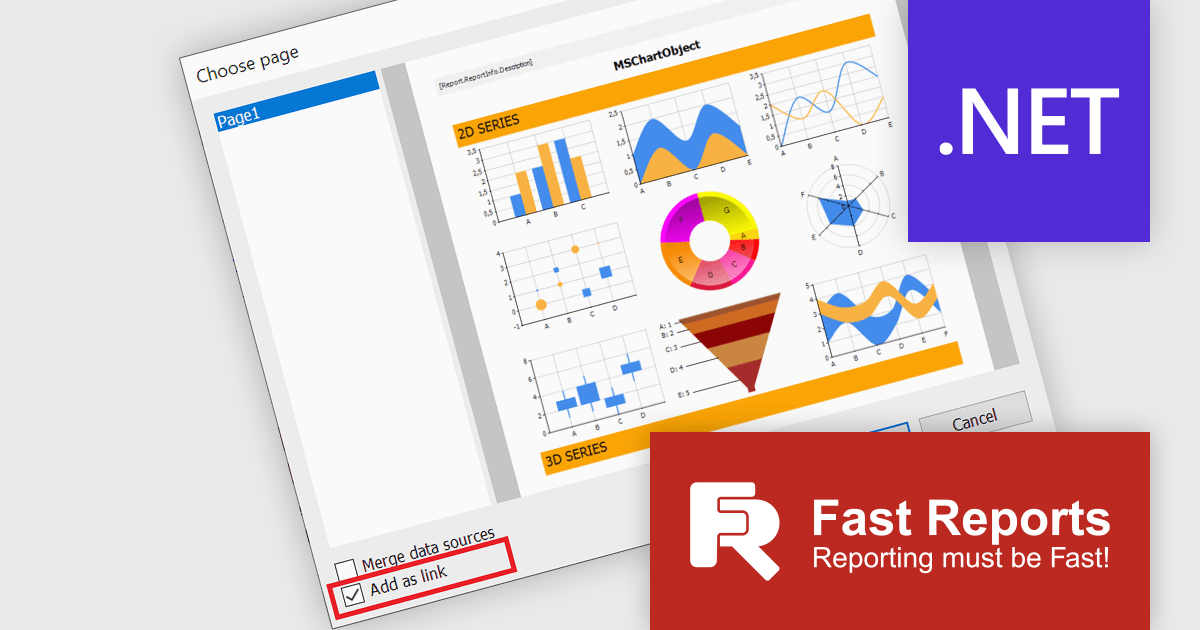
The FastReport .NET 2025.1 update introduces a valuable new feature that allows developers to add a report page as a link, instead of inserting the page into the report. This enhances report modularity and flexibility allowing developers to integrate external report pages into existing reports without duplicating content, simplifying maintenance and updates. By linking report pages, developers can efficiently reuse content across multiple reports, ensuring consistency while reducing the need for repetitive configuration. This feature is particularly advantageous for complex reporting scenarios where maintaining a single source of truth is essential.
To see a full list of what's new in 2025.1, see our release notes.
FastReport .NET is licensed per named user with options for Single, Team or Site Licenses. See our FastReport .NET Component Packages licensing page for full details.
Learn more on our FastReport .NET Component Packages product page.
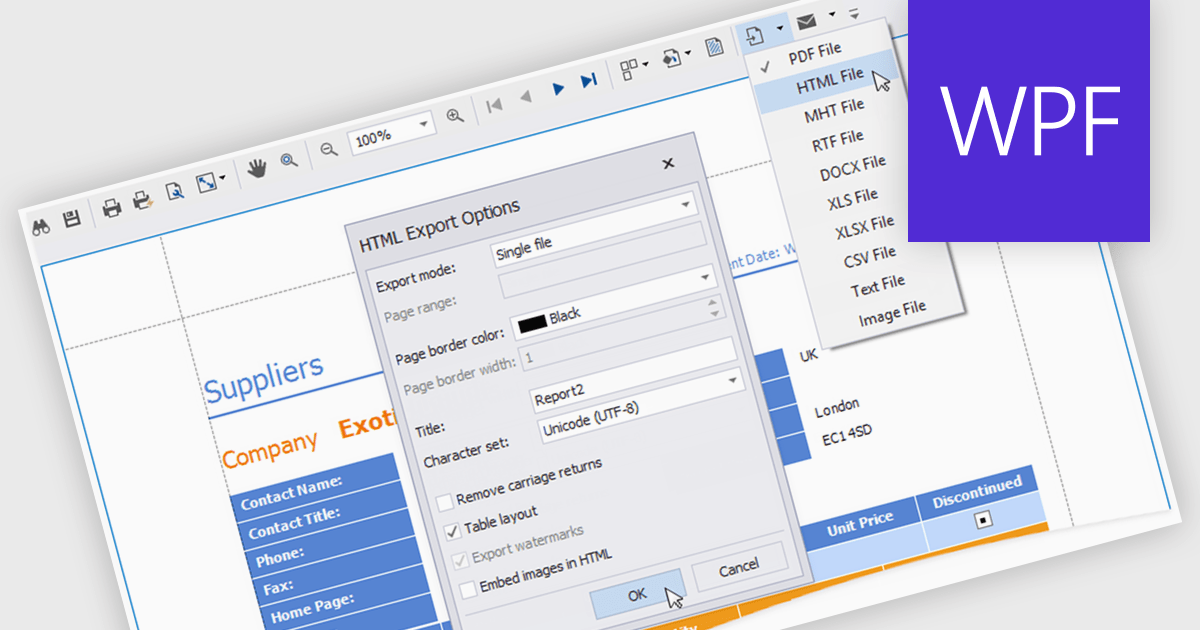
HTML export offers a versatile and accessible solution for sharing and distributing data-driven report insights. Transforming complex data into human-readable HTML format enables stakeholders to easily view, understand, and interact with reports. This functionality is particularly valuable for teams that need to collaborate on analysis or share findings with individuals who may not have access to specialized reporting tools. HTML exports can be integrated into various platforms, such as websites, emails, or shared documents, making it a convenient method for disseminating information and promoting data-driven decision-making.
Several .NET WPF reporting controls offer HTML exporting including:
For an in-depth analysis of features and price, visit our WPF Reporting controls comparison.
Stimulsoft Reports.WPF is a powerful reporting component for Windows Presentation Foundation (WPF) that provides rich rendering, viewing, printing, and exporting capabilities, allowing users to easily create, customize, and execute complex reports with minimal code, featuring a designer, data binding, WYSIWYG printing, and support for multiple export formats.
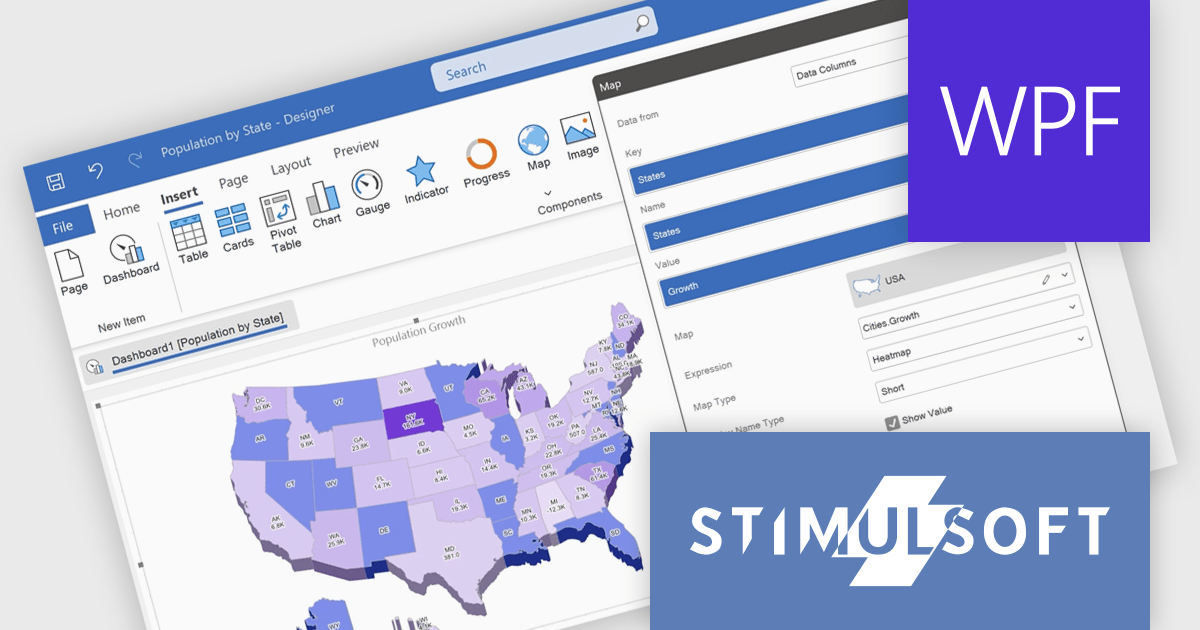
The Stimulsoft Reports.WPF 2024.4.1 release adds 3D support for maps in reports which allows for a more engaging and detailed visualization of geographic data. This feature can be easily turned on or off through the component editor or by using the Show 3D property, offering greater flexibility and making it easier to analyze spatial data with enhanced clarity.
To see a full list of what's new in 2024.4.1, see our release notes.
Stimulsoft Reports.WPF is licensed per developer and is available as a perpetual license with 1 year support and maintenance. See our Stimulsoft Reports.WPF licensing page for full details.
Stimulsoft Reports.WPF is available in the following products:
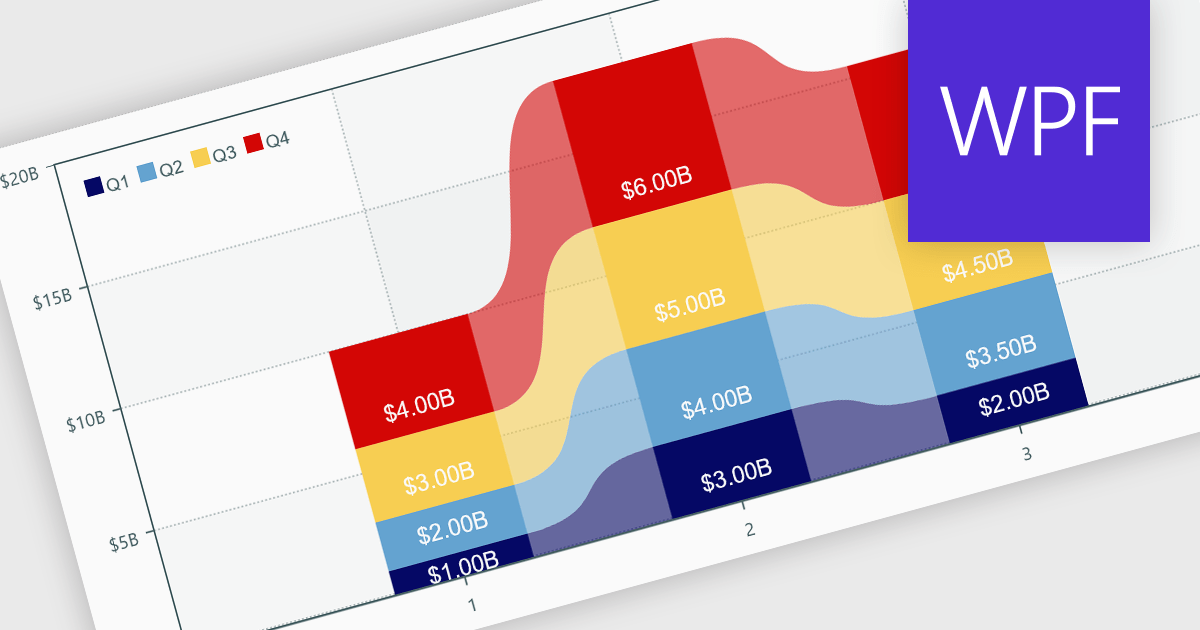
Charts within reports are graphical representations of data that allow users to visually interpret trends, comparisons, and patterns. They can take various forms, such as bar charts, line charts, or pie charts, and are typically integrated into dashboards or reporting tools to provide clear insights at a glance. By simplifying data visualization, charts enhance user experience and make it less taxing for users to understand complex information. Charts can be dynamically updated with real-time data, allowing for more responsive and insightful reporting in applications.
Several .NET WPF reporting controls offer support for charts including:
For an in-depth analysis of features and price, visit our comparison of .NET WPF Reporting controls.
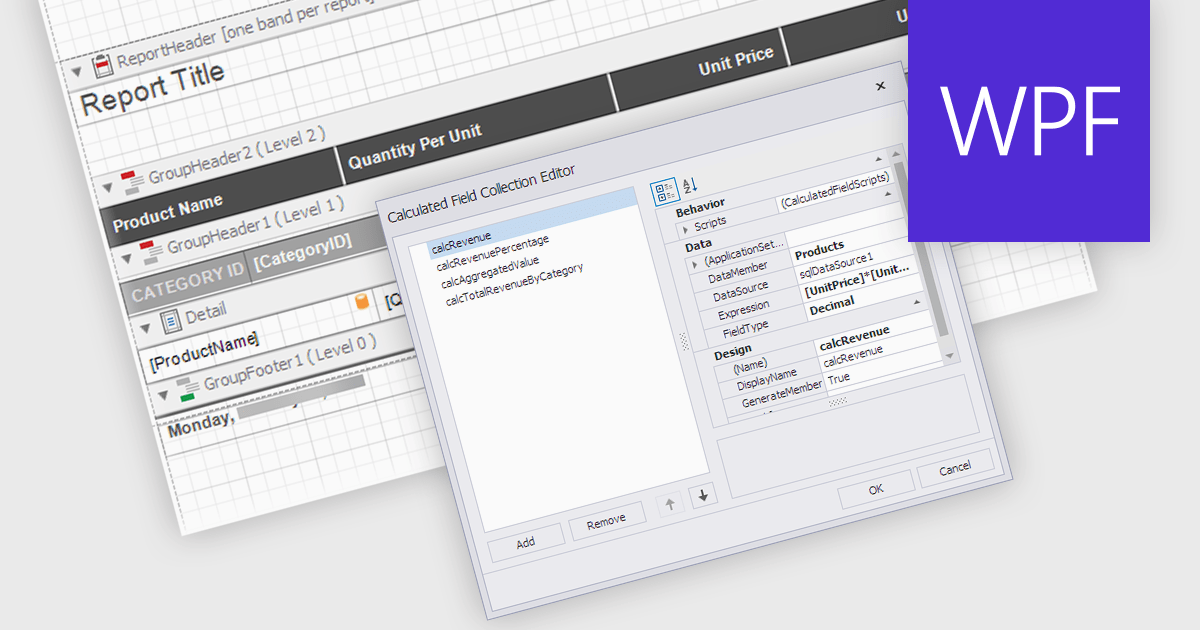
Calculated Fields in .NET WPF Reporting controls enable developers to dynamically compute values based on data from the report's dataset. These fields are not part of the original data source but are created by applying expressions, functions, or formulas to existing data. By leveraging calculated fields, developers can customize reports with real-time data manipulation, allowing for more sophisticated analysis and presentation without altering the underlying data model. The key benefits include reducing the need for external data processing, improving performance by handling computations within the report, and offering more flexibility in how data is displayed and interpreted.
Several .NET WPF reporting controls offer calculated field functionality including:
For an in-depth analysis of features and price, visit our comparison of .NET WPF Reporting controls.
Tel: (888) 850 9911
Fax: +1 770 250 6199


