


Proveedor oficial
Como distribuidores oficiales y autorizados, le suministramos licencias legítimas directamente de más de 200 editores de software.
Ver todas nuestras marcas.
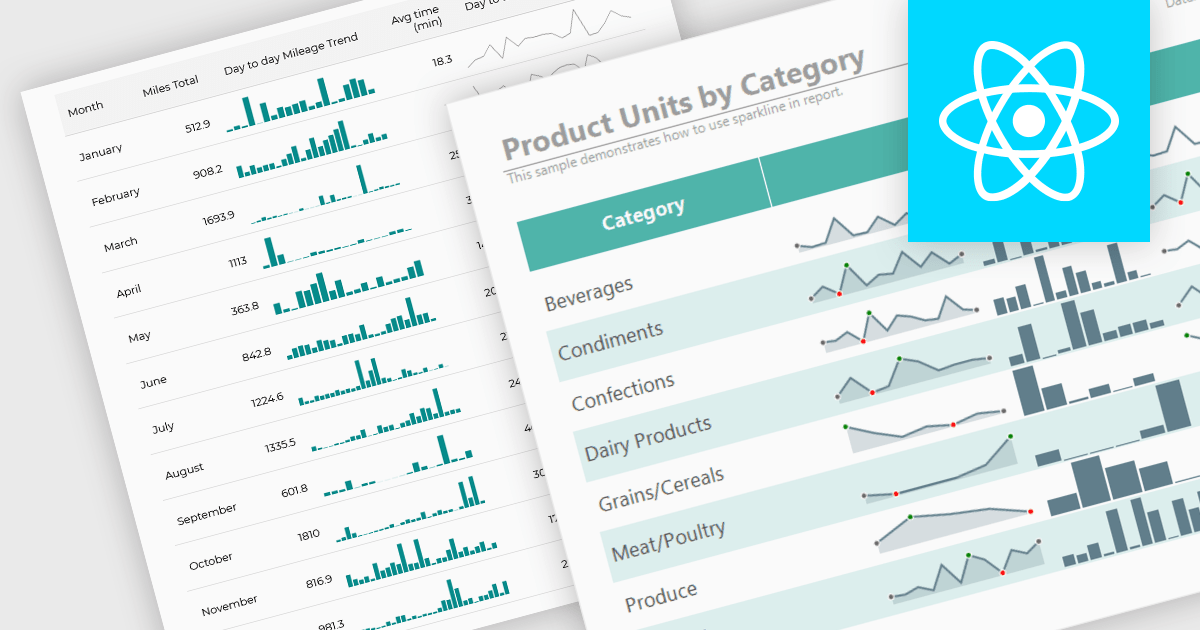
Sparklines are compact, data-rich graphics embedded within reports to illustrate trends, variations, or patterns over time. These miniature charts, typically rendered as lines, columns, or bars, offer a concise visual summary without the need for full-scale graphs. By integrating sparklines directly into data tables or summaries, reporting tools enable users to quickly grasp performance metrics or fluctuations at a glance, enhancing the interpretability of complex datasets.
Several React reporting controls offer sparklines including:
For an in-depth analysis of features and price, visit our React reporting controls comparison.
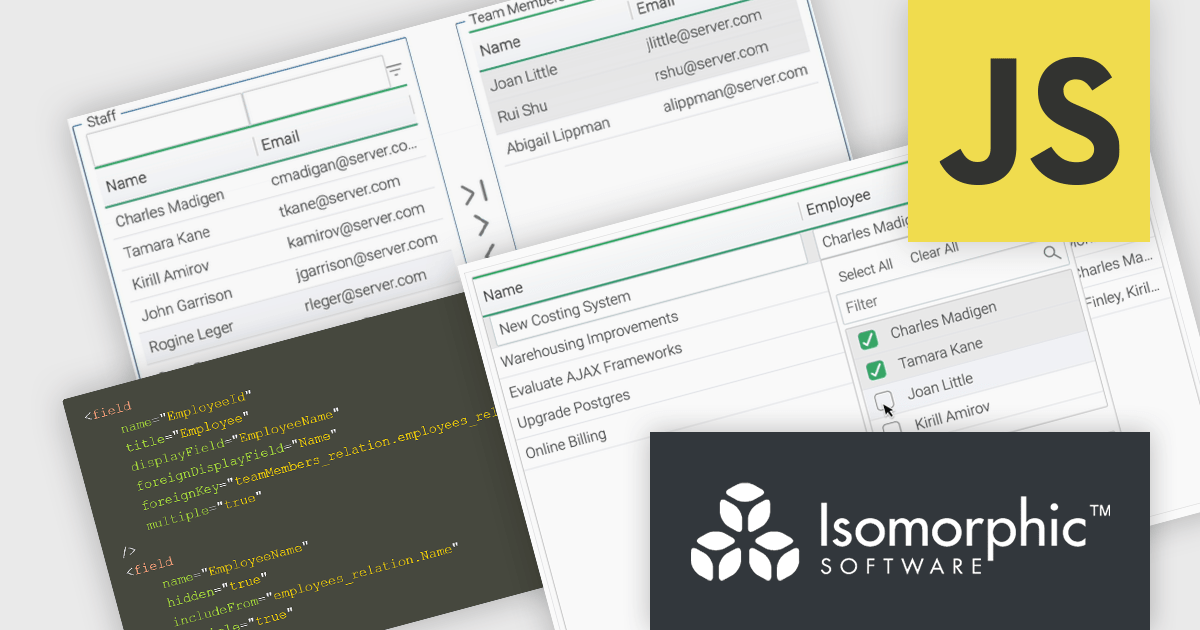
SmartClient is a comprehensive JavaScript component suite compatible with React, Vue, Angular, and more, that allows you to create large-scale, high-productivity web applications. It provides a comprehensive set of tools for developers, including advanced UI components, robust data management capabilities, and integration with modern backend technologies. Key features include dynamic data fetching, customizable grids, and a responsive interface for a wide range of devices. SmartClient enables developers to create applications with optimized performance, scalability, and a superior user experience. Ideal for enterprise-grade use cases, such as financial analytics, inventory management, and real-time reporting, SmartClient empowers organizations to deliver feature-rich applications that handle complex data requirements with ease.
Relations connect objects to each other and are used in databases and systems that are object-oriented. SmartClient lets you declare these relations in your data source using Relation Fields, providing a full access to related data without the need to write additional code. With two new user interface (UI) components for editing related records and the Relation Fields feature, it is now easier to manage many-to-many relationships. "MultiPickerItem" is a compact control used for inline form editing where the selected values appear inline and a pop-up displays checkboxes to enable users to select from a related data source. The Shuttle Interface can be embedded in any layout, including forms and modals, and provides a visual dual-panel interface for handling multi-item associations. These features simplify the management of relational data, offering users a declarative, scalable, and user-friendly approach.
SmartClient is licensed per developer and is available as both perpetual and subscription licenses. Product updates and technical support is also available. See our SmartClient licensing page for full details.
For more information, visit our SmartClient product page.
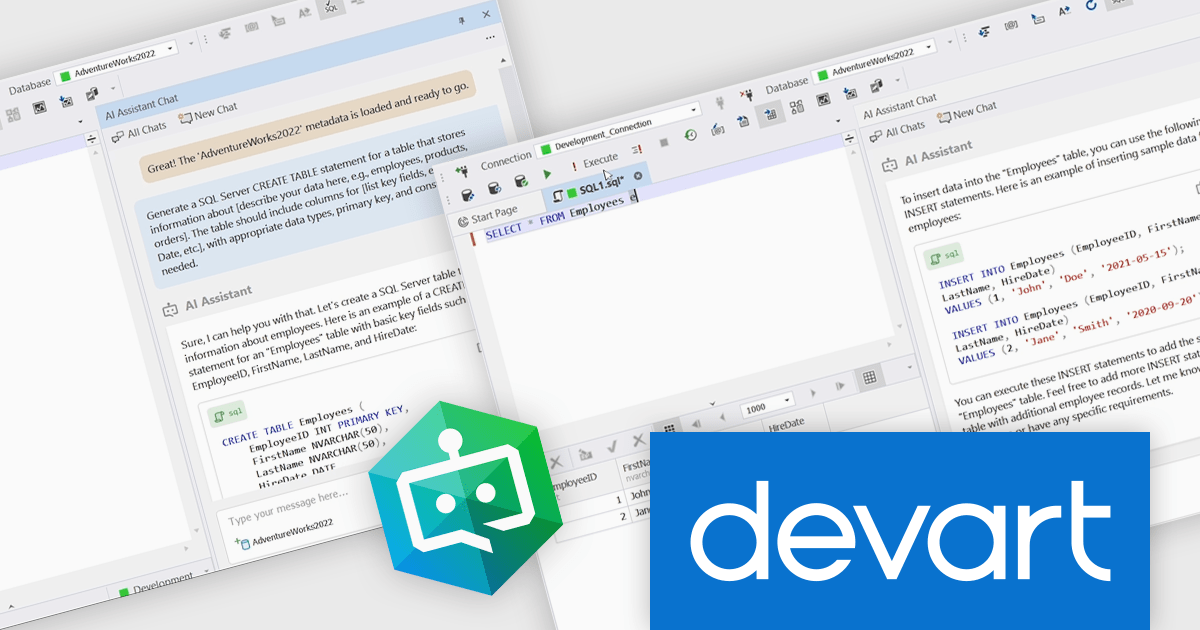
dbForge AI Assistant by Devart is an add-in within the dbForge product line that brings artificial intelligence to SQL development. It allows developers to generate SQL queries from natural language input, automatically adapting to the structure and context of the connected database. The assistant provides intelligent, context-aware suggestions and explanations, helping improve the coding process without requiring users to leave the dbForge environment. It supports a range of relational database systems, including SQL Server, MySQL, PostgreSQL, Oracle, and MariaDB.
The dbForge AI Assistant improves development efficiency by reducing the need for manual query writing and debugging. It helps identify and correct errors in real time, optimizes SQL performance, and supports developers in understanding complex queries through clear, line-by-line explanations. Use cases include accelerating report generation, simplifying onboarding for developers new to SQL, improving code quality in collaborative environments, and automating routine query tasks.
On July 10, 2025 at 7:00 CET / 11:00 AM EDT, Devart will be presenting presenting a Webinar to explore the powerful features of the dbForge AI Assistant. Join them and learn how to bring smart, context-aware help right into your dbForge workspace.
Register for the LIVE webinar today, and mark your calendar for July 10.
dbForge AI Assistant is licensed per user and is available as an Annual License. See our dbForge AI Assistant licensing page for full details.
Learn more on our dbForge AI Assistant product page.
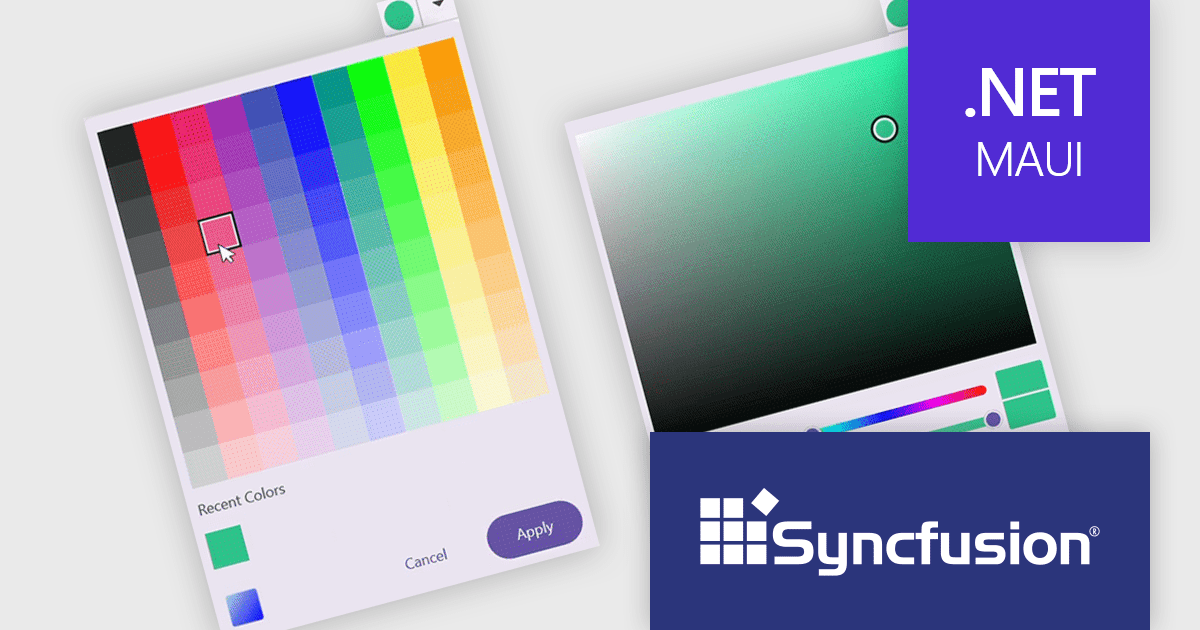
Syncfusion Essential Studio .NET MAUI (available as part of Syncfusion Essential Studio Enterprise) empowers developers with a comprehensive suite of native UI controls, data visualization tools, and performance optimizations for building modern, cross-platform mobile and desktop applications. This professional-grade toolkit leverages the power of C# and XAML, enabling rapid development of stunning and responsive experiences across diverse platforms.
The Syncfusion Essential Studio .NET MAUI 2025 Volume 2 update introduces a new Color Picker in preview, giving developers a flexible and efficient way to implement color selection in their applications. This control supports both palette and spectrum selection modes, allows direct input of RGB, HSV, and HEX values, and includes features such as opacity adjustment, recent color tracking, and theme adaptation. With inline display options and programmable interaction states, the Color Picker is well-suited for scenarios requiring user-driven customization while maintaining design consistency across different UI themes.
To see a full list of what's new in 2025 Volume 2 (30.1.37), see our release notes.
Syncfusion Essential Studio .NET MAUI is available as part of Syncfusion Essential Studio Enterprise which is licensed per developer starting with a Team License of up to five developers. It is available as a 12 Month Timed Subscription License which includes support and maintenance. See our Syncfusion Essential Studio Enterprise licensing page for full details.
Learn more on our Syncfusion Essential Studio .NET MAUI product page.
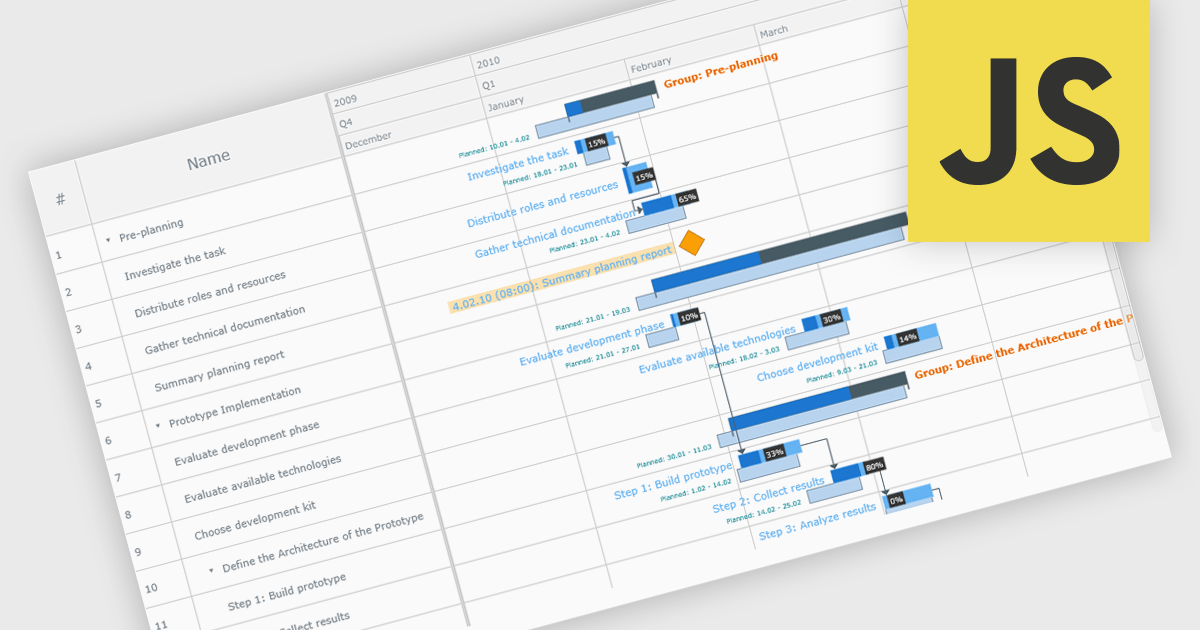
A Gantt chart is a visual project management tool that displays tasks or activities along a timeline, allowing teams to see the start and end dates, duration, and dependencies of each task within a project. Typically represented as horizontal bars across a calendar-based axis, Gantt charts provide a clear overview of project progress and help identify potential bottlenecks or scheduling conflicts. Gantt charts improve planning, scheduling, team coordination, and stakeholder transparency by clearly organizing tasks and timelines. They are especially valuable in complex projects, offering both macro and micro views to support informed decision-making and efficient execution.
Several JavaScript chart controls provide Gantt charts including:
For an in-depth analysis of features and price, visit our JavaScript chart controls comparison.
Tel: (888) 850 9911
Fax: +1 770 250 6199


