


Proveedor oficial
Como distribuidores oficiales y autorizados, le suministramos licencias legítimas directamente de más de 200 editores de software.
Ver todas nuestras marcas.
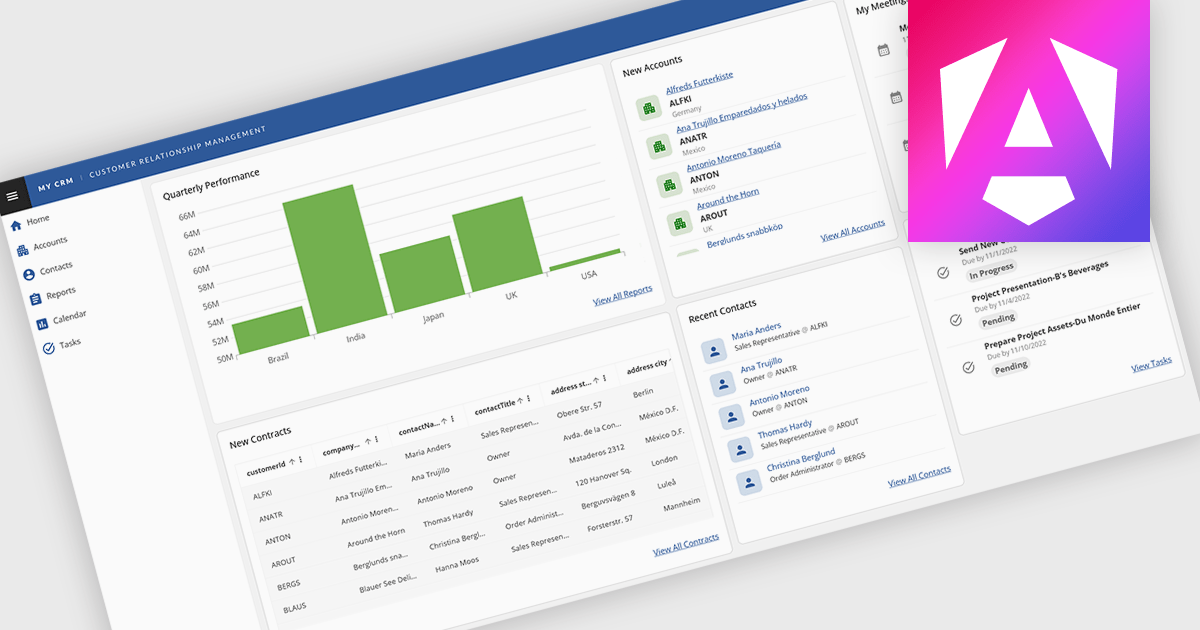
Layout components in UI suites provide structured systems for arranging and aligning interface elements, giving developers a consistent and efficient way to build user interfaces. By simplifying positioning and handling responsive behavior, they reduce development complexity while ensuring a cohesive design across screens and devices. This leads to faster development, improved maintainability, and a better user experience. Common use cases include creating responsive dashboards, organizing forms, structuring navigation, and building applications that need to adapt across multiple devices.
Several Angular UI suites offer layout components including:
For an in-depth analysis of features and price, visit our Angular UI suites comparison.
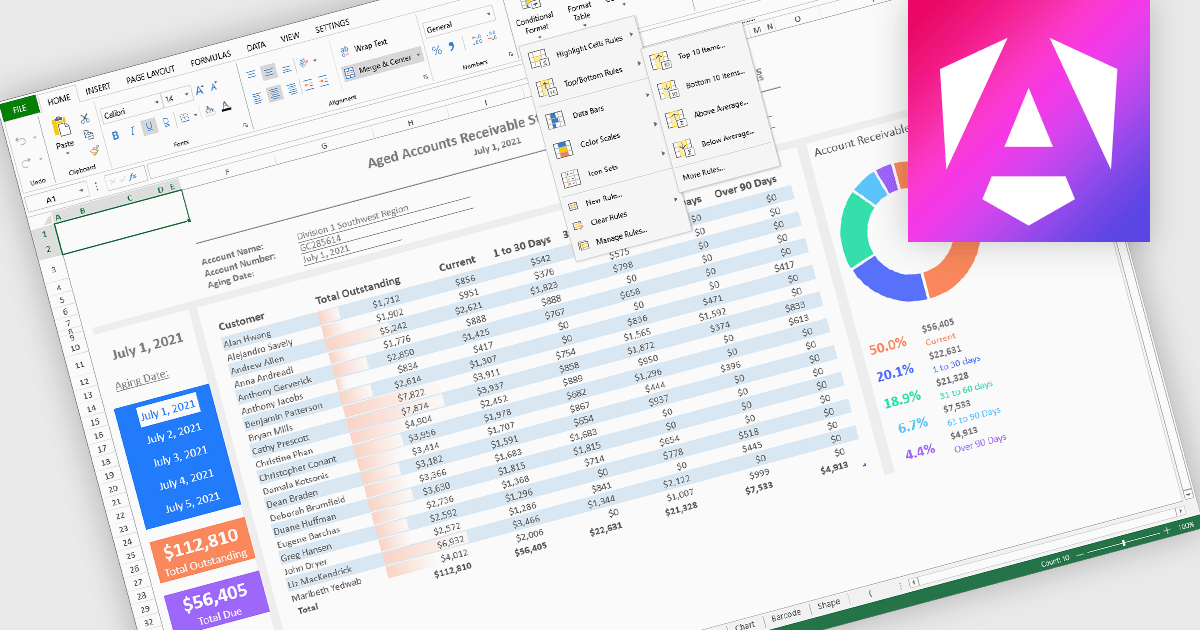
Conditional formatting in spreadsheet components allows developers to dynamically change the appearance of cells based on their values or defined rules. This feature helps highlight important data points, trends, and exceptions without requiring manual updates, making it easier for users to interpret large datasets at a glance. By applying visual cues such as colors, icons, and data bars, conditional formatting enhances readability and supports faster, more informed decision-making within spreadsheet-driven applications.
Several Angular spreadsheet controls offer support for conditional formatting including:
For an in-depth analysis of features and price, visit our Angular spreadsheet controls comparison.
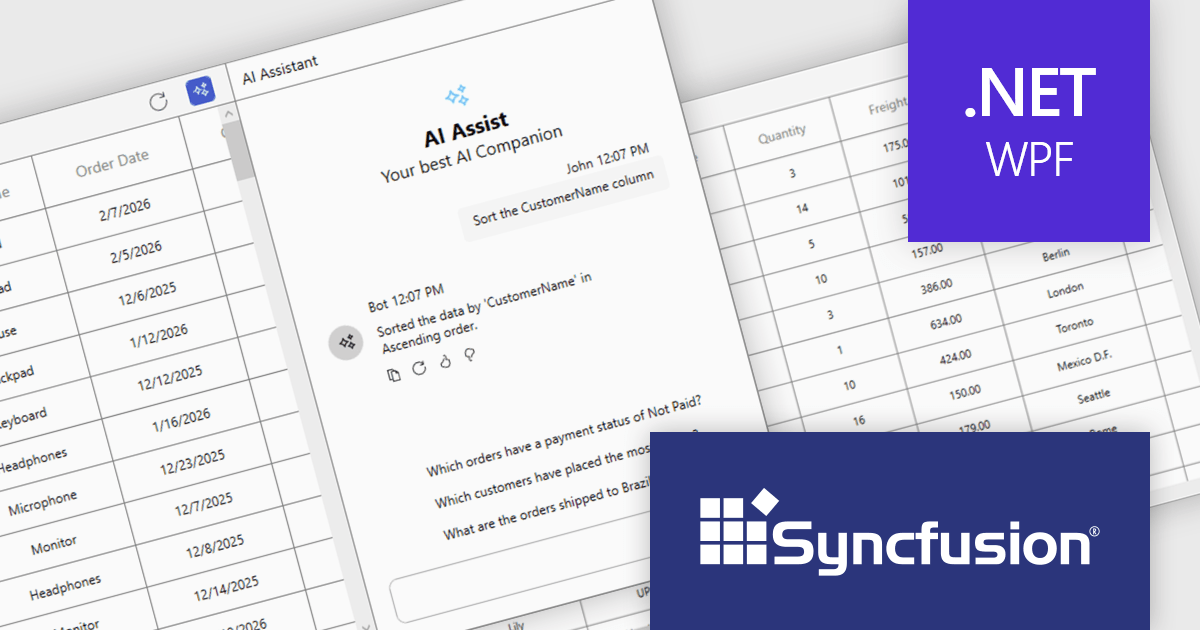
Syncfusion Essential Studio UI Component Suite is a comprehensive collection of user interface controls designed to support the development of modern, high-performance applications across web, desktop, and mobile platforms. It provides a wide range of components, from data grids and charts to schedulers and rich text editors, all built with a consistent API and strong integration across frameworks such as .NET, JavaScript, and Flutter. With a focus on reliability, scalability, and ease of use, it enables development teams to accelerate application delivery while maintaining flexibility and control over the user experience..
The Syncfusion Essential Studio UI Component Suite 2026 Volume 1 update introduces the Smart DataGrid, enabling developers to integrate natural language driven data interaction into modern WPF applications. This feature allows users to query, sort, filter, group, and highlight data through simple prompts, reducing the need for complex query logic and custom UI implementations. By supporting advanced scenarios such as multi condition filtering and contextual grouping, it improves development while maintaining flexibility and control. As a result, developers can deliver more intuitive data experiences faster, improve application usability, and reduce the overall effort required to implement rich data handling capabilities.
To see a full list of what's new in 2026 Volume 1 (33.1.44), see our release notes.
Syncfusion Essential Studio UI Component Suite is available as part of Syncfusion Essential Studio Enterprise which is licensed per developer and is available as a 12 Month Timed Subscription License which includes support and maintenance. See our Syncfusion Essential Studio Enterprise licensing page for full details.
Learn more on our Syncfusion Essential Studio Enterprise product page.
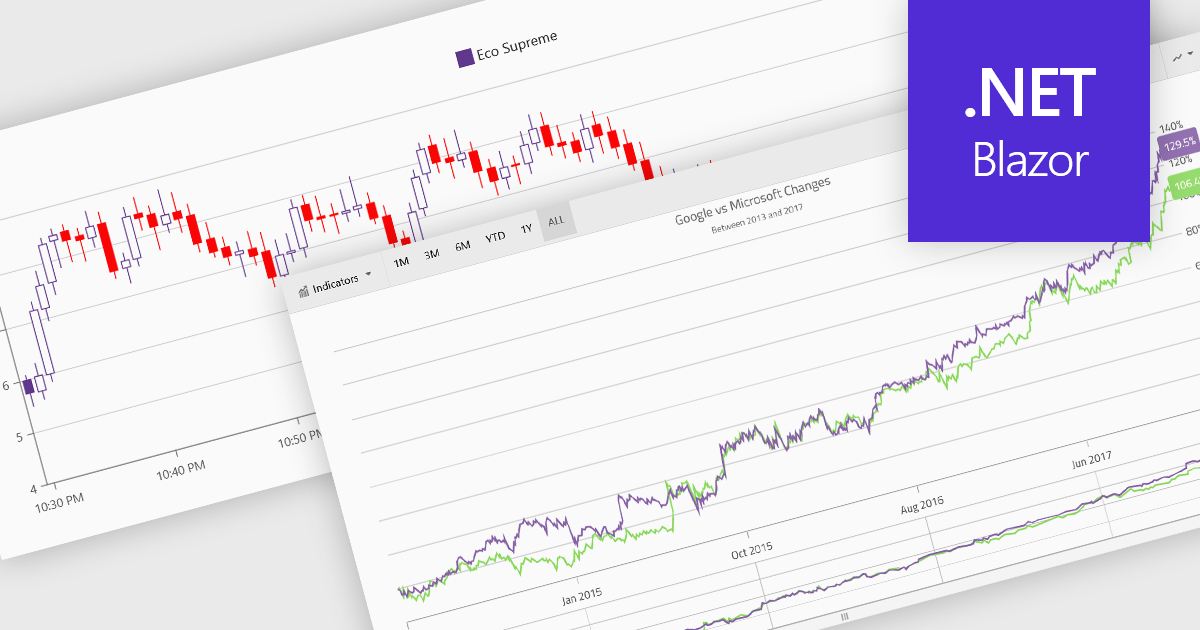
Financial charts are specialized visualizations designed to represent market data and price movements over time. Commonly used in trading platforms and analytical applications, these charts help users interpret open, high, low, and close values, as well as trends and volatility. By providing standardized financial visualizations, charting components enable developers to deliver tools that support technical analysis, decision-making, and real-time data exploration in finance-focused applications.
Common features include:
For an in-depth analysis of features and price, visit our Blazor charts components comparison.
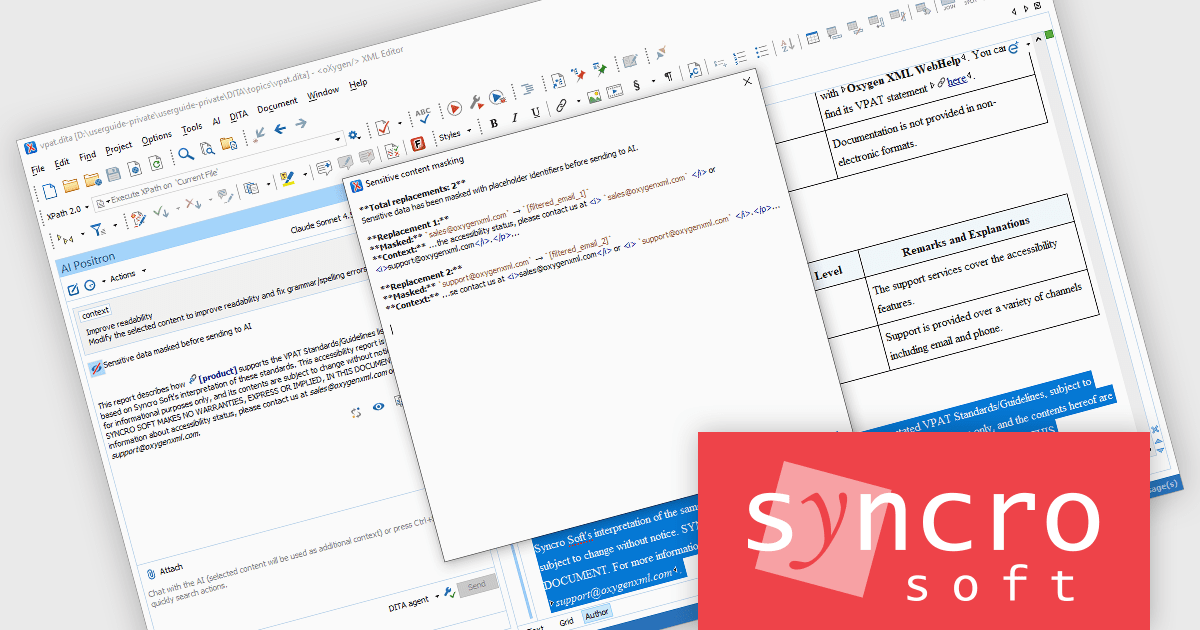
The Oxygen AI Positron Assistant Enterprise Plug-in by Syncro Soft is an Artificial Intelligence powered extension for the Oxygen XML editing suite designed specifically for technical writers. It leverages OpenAI, Microsoft Azure OpenAI Service, or Anthropic Claude to automate repetitive tasks, improve content structure and flow, and generate draft text based on user prompts. The plugin easily integrates within the Oxygen environment, offering visual comparisons of suggested changes and allowing developers to control the creative process through ongoing prompts and revisions..
Oxygen AI Positron Assistant Enterprise adds the ability to mask sensitive data for AI requests. As teams increasingly rely on AI services for tasks such as content generation, validation, or transformation, protecting confidential information becomes essential. Data masking ensures that sensitive fields, such as personal data, credentials, or proprietary information, are automatically obfuscated before being sent to external AI systems. This allows organizations to benefit from AI-driven productivity while reducing the risk of data exposure, supporting regulatory compliance, and maintaining trust in environments where secure data handling is a priority.
Oxygen AI Positron Assistant Enterprise is licensed per Named user and is available as a Timed License with support and maintenance subscription. See our Oxygen AI Positron Assistant Enterprise licensing page for full details.
Learn more on our Oxygen AI Positron Assistant Enterprise product page.
Tel: (888) 850 9911
Fax: +1 770 250 6199


