


Proveedor oficial
Como distribuidores oficiales y autorizados, le suministramos licencias legítimas directamente de más de 200 editores de software.
Ver todas nuestras marcas.
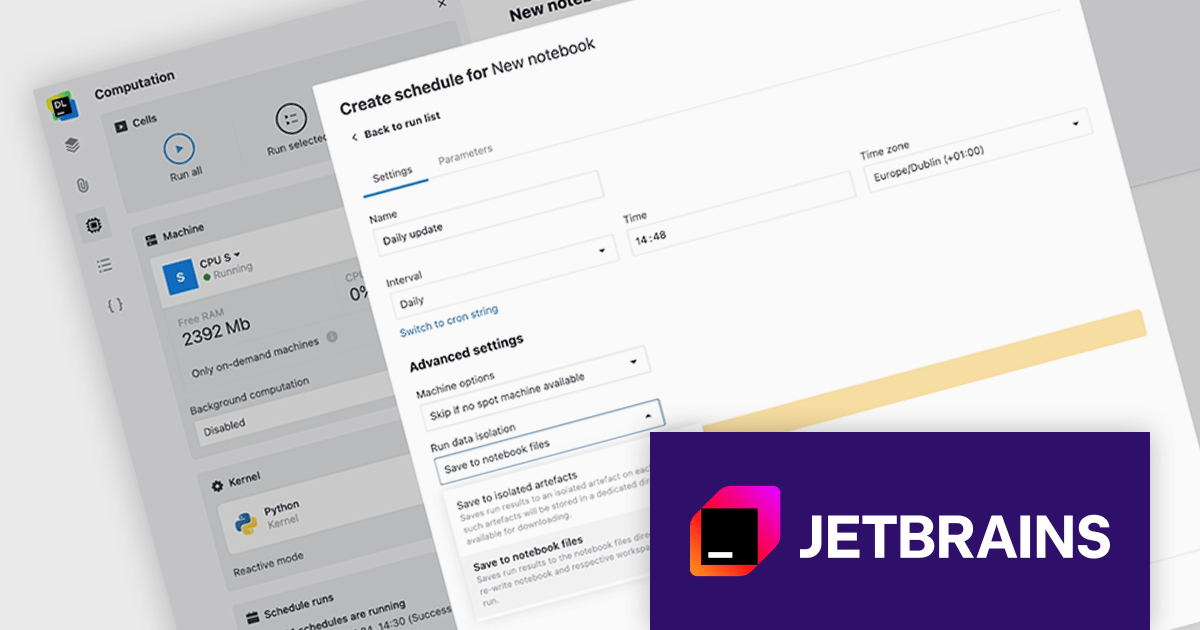
JetBrains Datalore is a collaborative data science platform that streamlines data exploration, analysis, and visualization through Jupyter-compatible notebooks. It empowers teams with features like automatic visualizations, pre-configured environments, interactive controls, and seamless collaboration functionalities. Datalore offers both cloud-based and self-hosted deployment options, catering to both individual and team-based data science workflows.
The Datalore 2024.3 update helps streamline your scheduled notebook runs with enhanced file handling. Now you can choose to save output files directly to a centralized location, mimicking the behavior of regular notebook sessions. This eliminates the need for manual file transfers and keeps all your scheduled run outputs organized in one place. It also offers the flexibility to overwrite existing files, ensuring you always have the latest data. The existing option for isolated artifacts remains available, giving you complete control over your scheduled workflow's file management.
To see a full list of what's new in version 2024.3, see our release notes.
Datalore is licensed per user, and is available as a commercial annual subscription license. See our Datalore licensing page for full details.
For more information, visit our Datalore product page.

This year marks the 20th anniversary of the partnership between ComponentSource and Antenna House. Over the past two decades, these two companies have worked together to provide reliable document formatting solutions to the global developer community.
Founded in 1984, Antenna House is a software company specializing in enterprise solutions for automated document formatting and conversion. Its flagship product, AH Formatter, leverages W3C standards like XSL-FO and CSS to offer a powerful and reliable solution for high-volume document formatting needs in various formats including PDF, SVG, and Microsoft Word. Antenna House software is used worldwide to produce millions of pages daily, across a wide range of industries including financial services, aerospace/defense, automotive, telecommunications, and health care.
ComponentSource is a leading global distributor of software components and development tools. Established in 1995, the company provides developers with a comprehensive marketplace featuring a wide range of high-quality software components, libraries, and development tools designed to enhance productivity and streamline the development process.
The combination of ComponentSource's distribution capabilities and Antenna House's innovative products has enabled developers to manage and deliver content more efficiently. This collaboration has helped developers save time and achieve greater accuracy and professionalism in their work. As we mark this 20-year milestone, ComponentSource looks forward to continuing its collaboration with Antenna House, providing valuable tools and support to developers, and advancing the field of document formatting.
Learn more about Antenna House.
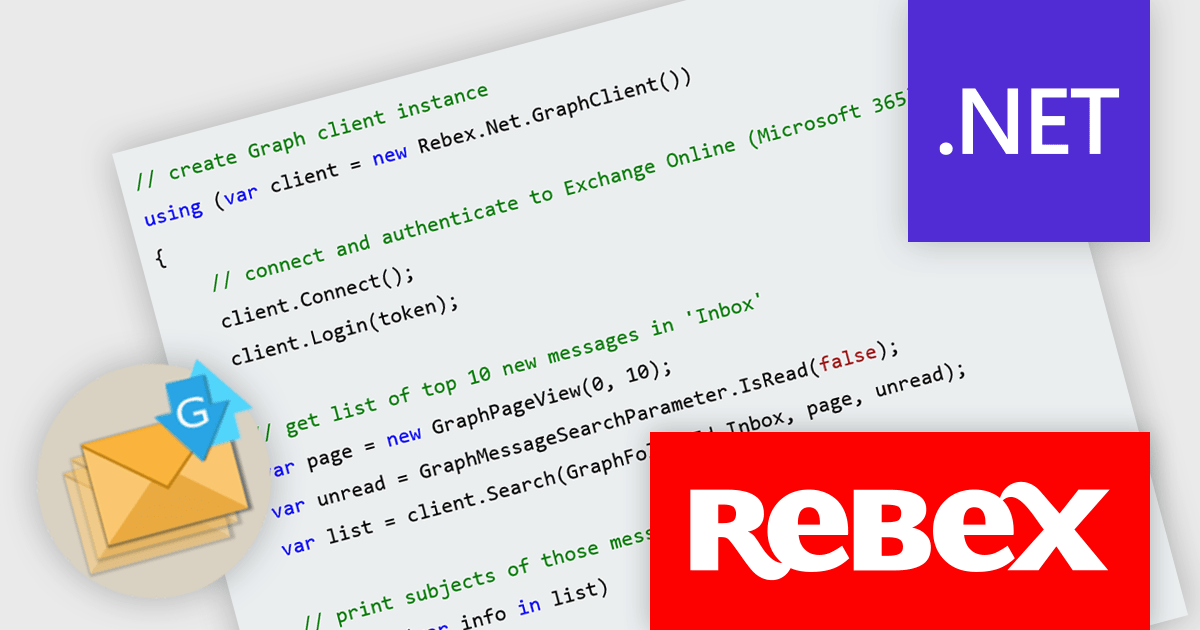
Rebex Graph is a powerful new .NET library designed to simplify working with Microsoft Graph, the central API for accessing Microsoft 365 services. It streamlines interaction with Exchange Online, a core component of Microsoft 365, enabling developers to leverage functionalities like sending, receiving, listing, and searching emails directly within their applications.
This streamlined access to Exchange Online unlocks a multitude of benefits for developers. Rebex Graph empowers them to build efficient email-centric applications without the need to deal with the complexities of the underlying protocols. It supports the latest security measures like TLS 1.3/1.2 and S/MIME, ensuring robust communication and data protection. These features make Rebex Graph a valuable tool for developers seeking to integrate secure and reliable email capabilities into their .NET applications.
Rebex Graph is licensed per developer and is available as a Perpetual License with a 1 Year Support Contract which includes priority support and all software updates. See our Rebex Graph licensing page for full details.
Learn more on our Rebex Graph product page.
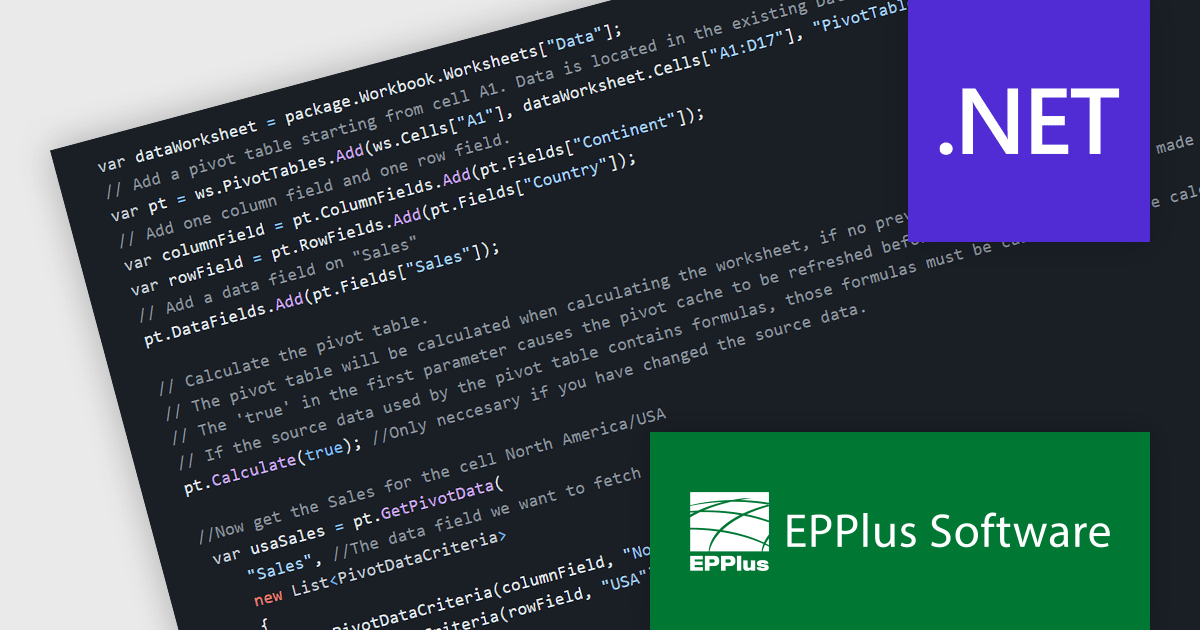
EPPlus is a powerful and versatile .NET library for managing and manipulating Microsoft Excel files using the Office Open XML (OOXML) format. It is a lightweight and efficient library that is easy to use and can be integrated into a wide range of applications. It allows developers to create, read and modify spreadsheets without dependencies on any other library. Features include pivot tables, styling, VBA/Form controls, conditional formatting, charts, tables, formula calculation, data validation, pictures/shapes, and more.
The EPPlus v7.2.0 update adds support for calculating and fetching data from pivot tables, allowing .NET developers to enhance the data analysis capabilities of their applications. This feature allows developers to dynamically summarize, analyze, and present large datasets by creating and manipulating pivot tables programmatically. It includes the ability to define calculations (sum, average, etc.) for rows and columns, format values as percentages or differences, and apply various filters (captions, numbers, dates, etc.) and sorting options. This streamlines data analysis workflows and fosters greater control over the final spreadsheet output, empowering developers to deliver more powerful data-driven solutions.
To see a full list of what's new in v7.2.0, see our release notes.
EPPlus is licensed per developer and is available as both perpetual licenses and subscription based licenses with periods of 1 year and 2 years, which include support and upgrades. See our EPPlus licensing page for full details.
For more information, see our EPPlus product page.
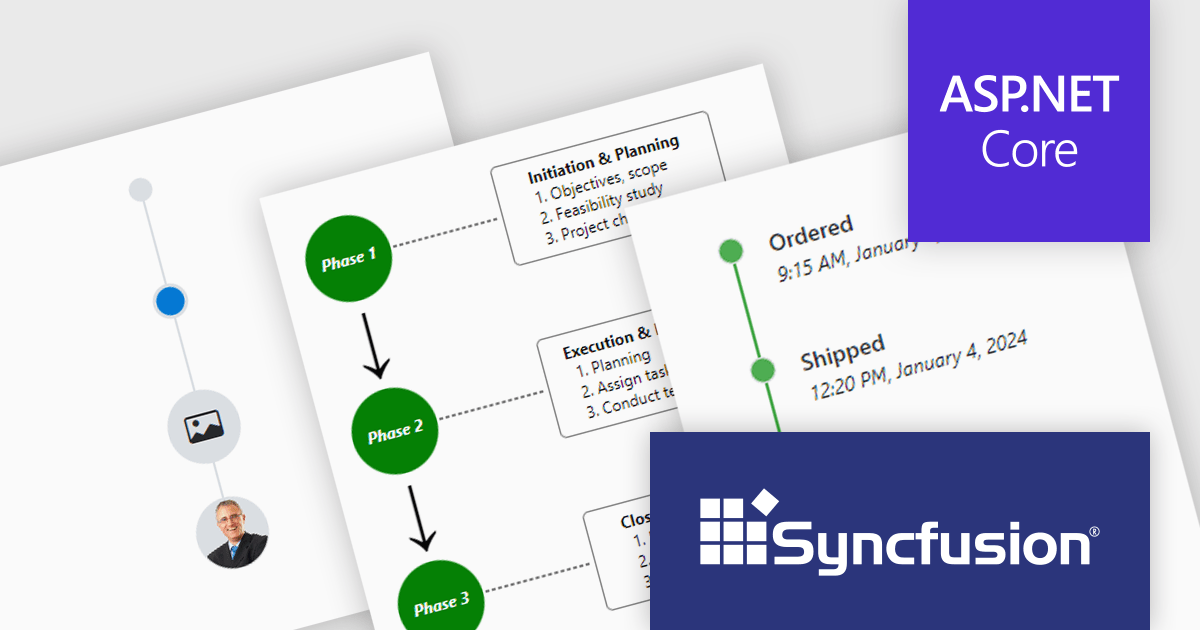
Syncfusion Essential Studio ASP.NET Core, available as part of Syncfusion Essential Studio Enterprise, empowers developers with a comprehensive suite of over 80 enterprise-grade UI components specifically designed for building modern and highly functional web applications. Leveraging the latest advancements in ASP.NET Core, it offers exceptional performance and scalability, streamlining development by eliminating the need for extensive custom coding. From data visualization tools like interactive charts and grids to sophisticated navigation elements and responsive layouts, Essential Studio equips developers with the building blocks to create rich user experiences, improve application efficiency, and accelerate time-to-market.
The Syncfusion Essential Studio ASP.NET Core 2024 Volume 2 (26.1.35) release introduces the production-ready Timeline component which displays a series of data in chronological order, providing a visually compelling and user-friendly experience. It can be used to showcase user activities, tracking progress, narrating historical timelines, and more. Built-in features include orientation, opposite content, item alignment, reverse timeline, and template customization.
To see a full list of what's new in 2024 Volume 2 (26.1.35), see our release notes.
Syncfusion Essential Studio ASP.NET Core is available as part of Syncfusion Essential Studio Enterprise which is licensed per developer starting with a Team License of up to five developers. It is available as a 12 Month Timed Subscription License which includes support and maintenance. See our Syncfusion Essential Studio Enterprise licensing page for full details.
Learn more on our Syncfusion Essential Studio ASP.NET Core product page.
Tel: (888) 850 9911
Fax: +1 770 250 6199


