


Proveedor oficial
Como distribuidores oficiales y autorizados, le suministramos licencias legítimas directamente de más de 200 editores de software.
Ver todas nuestras marcas.
Aspose is a software development company specializing in file format manipulation. It offers a comprehensive suite of award-winning APIs (Application Programming Interfaces) that enable developers to create, edit, convert, and render a wide range of file types, including Office documents (Word, Excel, PowerPoint), PDFs, images, and many more. These APIs are compatible with various programming languages and platforms, allowing developers to seamlessly integrate Aspose's functionality into their applications without relying on external software. ComponentSource has been in partnership with Aspose since 2006, helping to distribute its award-winning products to the global developer community.
Congratulations to Aspose on winning the #3 Publisher Award in the annual ComponentSource Awards for 2024, along with nine Product Awards. We're pleased to once again recognize Aspose's continued excellence in developing high-quality file format APIs.
Each year, the ComponentSource Awards leverage real global sales data to identify the top 100 bestselling software components and development tools. This recognition not only reflects real-world adoption by developers but also provides valuable insights into current market trends and preferred solutions, making it a trusted source for gauging developer preferences. For full details on this year's awards see:
JetBrains is a multinational software development company known for creating integrated development environments (IDEs) for various programming languages, including Java, Python, and JavaScript. Its core products, such as IntelliJ IDEA, PyCharm, and WebStorm, are widely regarded for their advanced code analysis capabilities and developer productivity tools. Additionally, JetBrains offers team collaboration tools like YouTrack and TeamCity, enhancing project management and continuous integration services for developers across the globe. These offerings make it a pivotal entity in the software development industry, catering to both individual programmers and large enterprises. ComponentSource has been in partnership with JetBrains since 2007, helping to distribute its award-winning products to the global developer community.
Congratulations to JetBrains on winning a Top 5 Publisher Award in the annual ComponentSource Awards for 2024, along with seven Product Awards. We're pleased to once again recognize JetBrains's continued excellence in developing high-quality IDEs and developer tools.
Each year, the ComponentSource Awards leverage real global sales data to identify the top 100 bestselling software components and development tools. This recognition not only reflects real-world adoption by developers but also provides valuable insights into current market trends and preferred solutions, making it a trusted source for gauging developer preferences. For full details on this year's awards see:
Syncro Soft is a software company specializing in solutions for Extensible Markup Language (XML) technologies and single-source publishing. Its core product, Oxygen XML Editor, caters to both beginners and experts, offering tools for creating, editing, and publishing XML documents across various platforms. Syncro Soft's focus on XML and user experience positions it as a provider of innovative solutions for content creation and management. ComponentSource has been in partnership with Syncro Soft since 2008, helping to distribute its award-winning products to the global developer community.
Congratulations to Syncro Soft on winning a Top 5 Publisher Award in the annual ComponentSource Awards for 2024, along with seven Product Awards. We're pleased to recognize Syncro Soft's continued excellence in developing high-quality XML and single-source publishing tools.
Each year, the ComponentSource Awards leverage real global sales data to identify the top 100 bestselling software components and development tools. This recognition not only reflects real-world adoption by developers but also provides valuable insights into current market trends and preferred solutions, making it a trusted source for gauging developer preferences. For full details on this year's awards see:
Highsoft is a Norwegian software company specializing in data visualization tools for web and mobile applications. Its core product, Highcharts, is a popular JavaScript library that enables developers to create interactive charts of various types, including line, bar, pie, and scatter charts. Highsoft also offers additional libraries like Highcharts Stock and Highcharts Maps that extend Highcharts' functionality to visualize stock market data and geographic information. ComponentSource has been in partnership with Highsoft since 2017, helping to distribute its award-winning products to the global developer community.
Congratulations to Highsoft on winning the Top 10 Publisher Award in the annual ComponentSource Awards for 2024, along with Top 10 and Top 50 Product Awards. We're pleased to once again recognize Highsoft's ongoing excellence in developing high-quality data visualization solutions.
Each year, the ComponentSource Awards leverage real global sales data to identify the top 100 bestselling software components and development tools. This recognition not only reflects real-world adoption by developers but also provides valuable insights into current market trends and preferred solutions, making it a trusted source for gauging developer preferences. For full details on this year's awards see:
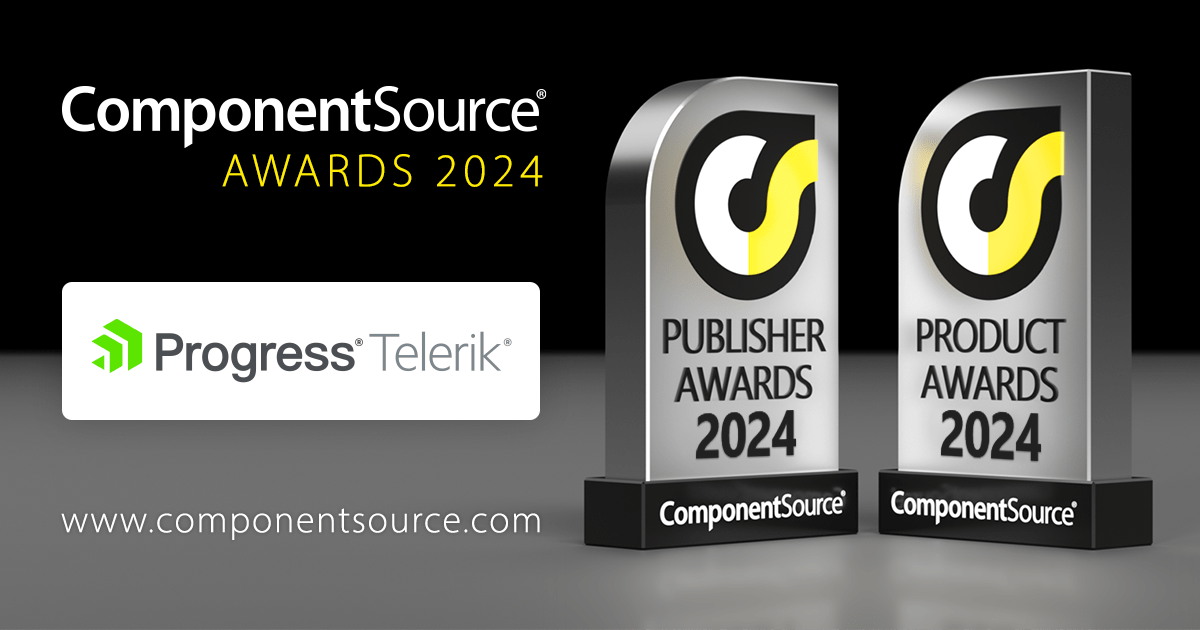
Progress Telerik is a leading provider of developer tools, offering UI components, reporting software, and developer productivity tools for various platforms. Its core products include Telerik and Kendo UI, which provide comprehensive libraries for building web, mobile, and desktop applications across popular frameworks like .NET and JavaScript. This allows developers to streamline the development process and create feature-rich applications faster. ComponentSource has been in partnership with Progress Telerik since 2018, helping to distribute its award-winning products to the global developer community.
Congratulations to Progress Telerik on winning the Top 10 Publisher Award in the annual ComponentSource Awards for 2024, along with Top 25, Top 50, and Top 100 Product Awards. We're pleased to once again recognize Progress Telerik's ongoing excellence in developing high-quality components and tools.
Each year, the ComponentSource Awards leverage real global sales data to identify the top 100 bestselling software components and development tools. This recognition not only reflects real-world adoption by developers but also provides valuable insights into current market trends and preferred solutions, making it a trusted source for gauging developer preferences. For full details on this year's awards see:
Tel: (888) 850 9911
Fax: +1 770 250 6199


