


Proveedor oficial
Como distribuidores oficiales y autorizados, le suministramos licencias legítimas directamente de más de 200 editores de software.
Ver todas nuestras marcas.
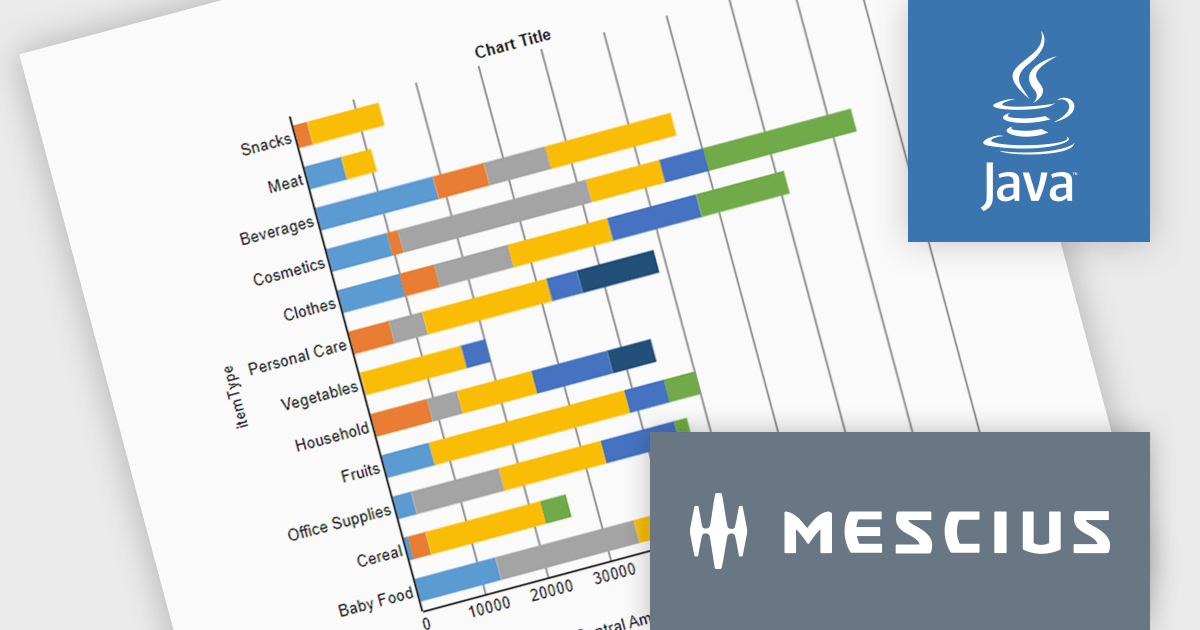
ActiveReportsJS is a powerful, lightweight reporting tool designed to integrate advanced reporting capabilities into any JavaScript application. ActiveReportsJS enables developers to create, view, export, and print richly formatted reports entirely on the client side - with zero server dependencies.
In this blog post, MESCIUS Product Engineer Sergey Abakumoff shows you how to integrate ActiveReportsJS, a 100% client-side JavaScript reporting tool with zero server dependencies, into a Java web application. Following his steps you will learn how to:
Detailed sample code is included to help you along.
Read the full blog to get started adding rich reporting capabilities to your Java web applications.
ActiveReportsJS is licensed on an annual subscription or perpetual basis and is available as a Single Deployment License for non-commercial use, and as a Single Domain License or Unlimited Domain License for commercial and/or SaaS use. See our ActiveReportsJS licensing page for full details.
For more information, visit our ActiveReportsJS product page.
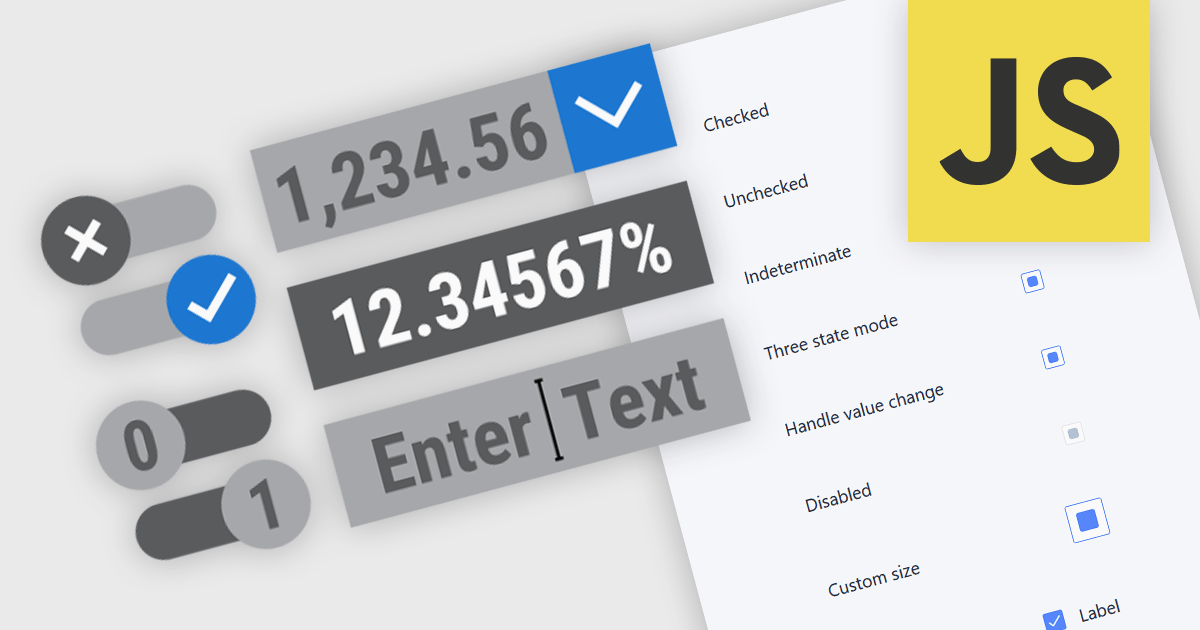
Text, numeric, and boolean data editor components for JavaScript provide the fundamental building blocks for capturing and validating user input in web applications. These editors are designed to handle a wide range of data types and interaction patterns, helping developers present consistent, accessible, and predictable input experiences across forms, grids, and dialogs while integrating cleanly with application logic and data models.
Common editors include:
For an in-depth analysis of features and price, visit our JavaScript data editors comparison.
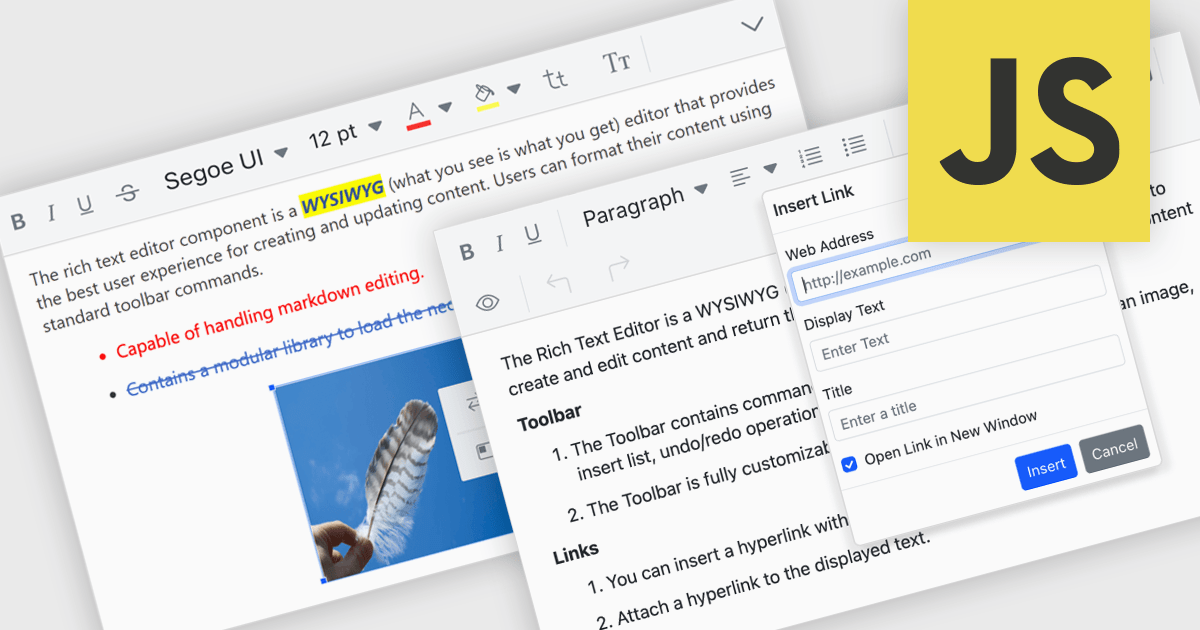
RTF editor support in a data editor component means the component can display, edit, and persist Rich Text Format (RTF) content, allowing users to work with formatted text that includes fonts, styles, alignment, and embedded elements rather than plain text. For software developers, this enables applications to store and manage rich textual data such as notes, descriptions, or documents directly within structured data processes, while relying on a standardized, well-supported format. The result is improved user input quality, consistent formatting across systems, and reduced need for custom text handling logic, while still maintaining compatibility with databases and backend services that expect structured data.
Several JavaScript data editor collections provide RTF editing capabilities including:
For an in-depth analysis of features and price, visit our comparison of JavaScript Data Editor components.
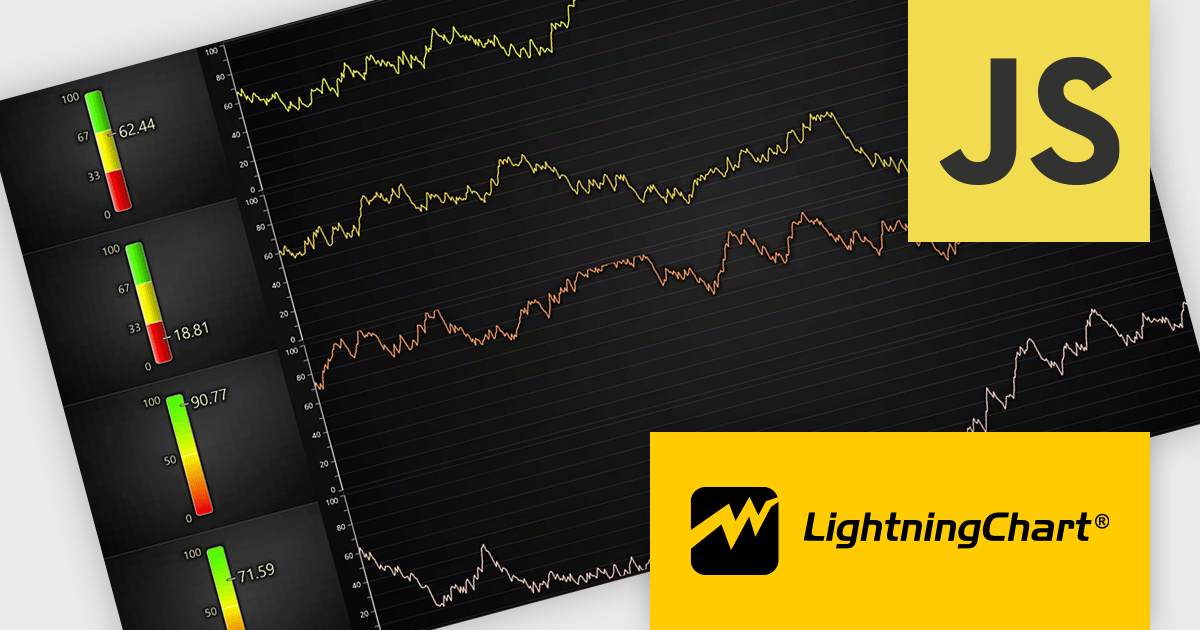
LightningChart JS is a high-performance JavaScript charting library that utilizes WebGL rendering and GPU acceleration to deliver exceptional performance for a wide range of data visualization needs. It is designed to handle large datasets and complex visualizations with ease, enabling developers to create interactive and visually appealing 2D and 3D charts. Ideal for applications demanding smooth real-time data updates, such as financial platforms, engineering tools, scientific research dashboards, and industrial monitoring systems, LightningChart JS provides a comprehensive API for customization and integration into web-based projects.
The LightningChart JS v8.2 update introduces a new Linear Gauge Chart that enables software developers to present real-time metrics in a clear, structured format within modern web applications. It supports continuous live data updates, configurable interpolated or discrete color steps for representing thresholds and ranges, and both vertical and horizontal orientations to accommodate different layout requirements. The chart also allows current values to be displayed directly on the gauge and supports custom icons, giving developers greater control over visual consistency while building intuitive, status-focused dashboards for monitoring and analytics use cases.
To see a full list of what's new in v8.2, see our release notes.
LightningChart JS is licensed per developer and is available as an annual license with 1 year support. See our LightningChart JS licensing page for full details.
For more information, see our LightningChart JS product page.
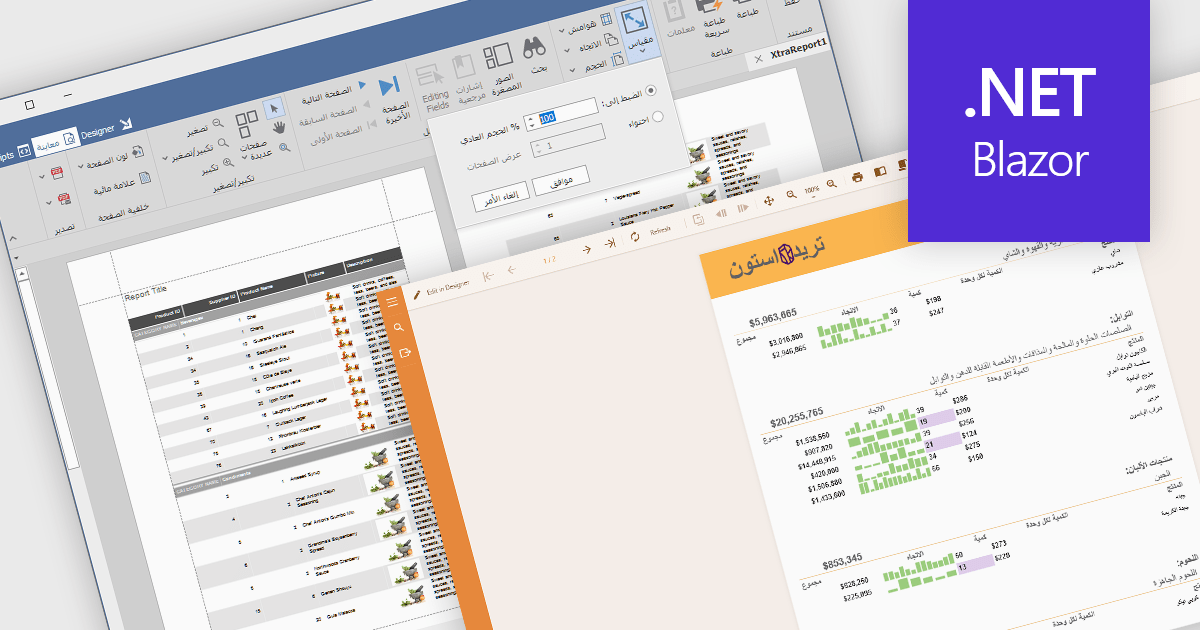
Right to left (RTL) support in reporting components enables reports to correctly display languages such as Arabic and Hebrew, where text flow, alignment, and layout follow a right-to-left reading order. This capability typically affects text rendering, page layout, table alignment, and user interface elements, helping reports remain readable and culturally appropriate without requiring separate report designs.
Several Blazor reporting controls offer right-to-left (RTL) support including:
For an in-depth analysis of features and price, visit our Blazor reporting controls comparison.
Tel: (888) 850 9911
Fax: +1 770 250 6199


