dotTrace Performance 4.5 released

Adds better organized snapshot views, less noise in call stacks and improved tree presentation and performance.
Junio 23, 2011
Nuevas funcionalidades

dotTrace Performance profiles the performance of .NET applications, ASP.NET applications running on Internet Information Server and Windows services. You can compare any two performance snapshots of the same application with dotTrace. dotTrace program interface features effective navigation, easy filtering and smart search options. dotTrace also features source preview.

Updates in 4.5

  • Less noise in call stacks and improved tree presentation - Content in snapshot views is now better organized: specifically, icons to the left of the tree no longer misalign its nodes. In addition, you can now quickly fold or unfold calls that take insignificant time with Ctrl+Space.
  • Extracting all public methods of a class to a single tab - You can now quickly view all public method calls from a certain class in a separate tab, which helps analyze the performance of a class along the lines of its API.
  • Improved estimation of potential performance gains - You can now adjust time of a function called from a specific parent function, leaving its other calls intact.
  • Sampling profiling is now used by default - Sampling is the fastest profiling mode that imposes least overhead. Of course, whenever you need to collect more detailed performance data, you can switch to tracing or line-by-line profiling.
  • Previewing .NET Framework source code - By connecting dotTrace 4.5 Performance to Microsoft Reference Source Server (via View | Options | Source Preview), you can preview the source code of .NET Framework when you analyze the behavior of library code in your snapshot.
  • Displaying IL code in source view - In the Source Preview area, you can now switch between source form and CIL form of methods that you're analyzing:
  • New floating license handling policy - This is an important change for customers who are using dotTrace integrated into Visual Studio in corporate environments. Before, a floating license ticket was issued right upon loading the dotTrace plug-in in Visual Studio irrelevant of whether a user actually needed it. Starting from dotTrace 4.5 Performance, a ticket is only requested after a user has performed an operation with dotTrace from within Visual Studio.
  • Performance improvements - dotTrace 4.5 Performance generates Hot Spots and Plain List views a lot faster than version 4.0. Acceleration has also been applied to search in Hot Spots view and canceling view construction on pressing Esc.

About JetBrains

JetBrains is a technology-leading software development firm specializing in the creation of intelligent, productivity-enhancing software. The company is widely known for its innovative, award-winning Java integrated development environment, IntelliJ IDEA, ReSharper developer productivity extension and dotTrace profiler for .NET developers, TeamCity - a continuous integration and build management environment, RubyMine - a Ruby and Rails IDE and others. JetBrains maintains its headquarters in Prague, Czech Republic, with its R&D labs located in St. Petersburg, Russia and Boston, Massachusetts.
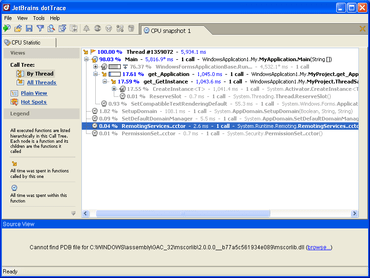
Viewing CPU statistics by thread with dotTrace.

dotTrace

A profiling solution for profiling the performance of your .NET applications.

dotTrace también está disponible en:

¿Alguna pregunta?

Chatee en vivo ahora mismo con nuestros especialistas en licencias de JetBrains.