FusionMaps XT V3.11.2

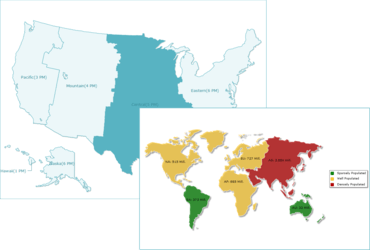
El mapa de USMSA ahora se representa con las entidades esperadas, además de ofrecer una representación gráfica más rápida.
Septiembre 22, 2016
Nueva versión

Características

  • Significantly improved chart rendering speed.
  • For all the charts in FusionCharts Suite XT, annotations can now be displayed above all the elements in the chart if  you set `showBelow=0`.

Correcciones

  • USMSA map now gets rendered with the expected entities.
  • The issue of chart caption and sub­caption overlapping the chart canvas in Google Chrome, when `canvasOnTop=1`, has been fixed.
  • Extra decimal values have now been removed when ​formatNumber attribute is false (0).
  • The feedData method now works as expected. Previously, this method was escaping characters for encoding.
FusionMaps XT

FusionMaps XT

Muestre datos geográficos como ingresos por regiones, resultados electorales y ubicaciones de oficinas con la efectividad que ofrecen los mapas interactivos.

FusionMaps XT también está disponible en:

¿Alguna pregunta?

Chatee en vivo ahora mismo con nuestros especialistas en licencias de FusionCharts.