ZingChart 2.5

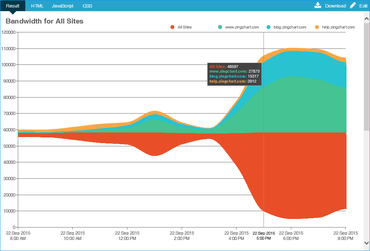
Ahora funciona con Flexbox, además de añadir Stream Graphs y feeds de Stream Graph.
Octubre 19, 2016
Nueva versión

Características

  • ZingChart now works with Flexbox.
  • New selection tool.
  • Stream Graphs.
  • Stream Graph feeds.
  • New event for context menu.
  • Added jsRule on radar charts.
  • Background image position has been adjusted for radial charts.
  • Treemap has new layout options: random, squarify, squarifyV2 and balancedV2.
  • Added a new hover layer for plot hover state. You can now have hoverstate behind certain items like scales. This option can be enabled with zingchart.DEV.PLOTSHLAYER.
  • Added new active attribute in the zoom object to allow disabling of the zoom mask.
  • If legend item and marker are set to {visible: false} the legend will become invisible.
  • Selected state now preserved on graph API interactions and resize events.
  • Token pie-total-value works with decimals attribute.
  • Gauge default tooltip color now inherits from background color.
Example stream graph.

ZingChart

Cree gráficos animados e interactivos con cientos de miles de registros de datos.

¿Alguna pregunta?

Chatee en vivo ahora mismo con nuestros especialistas en licencias de ZingChart.