Nevron Vision for .NET 2017.1

Compatibilidad con Microsoft Visual Studio 2017, además de nuevas características añadidas a Nevron Chart for .NET.
Junio 6, 2017
Nueva versión

Características

  • Support for Microsoft Visual Studio 2017.
  • Updates in Nevron Chart for .NET:
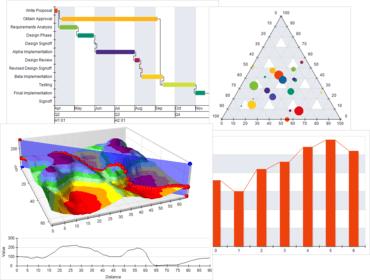
    • Ternary Point Series - The Ternary Point series displays point in a ternary coordinate system. Each point is specified by its A, B and C values which sum to a constant.
    • Ternary Bubble Series - The Ternary Bubble series displays bubbles in a ternary coordinate system. Each bubble is specified by its A, B and C values which sum to a constant and also has a fourth parameter that determines its size.
    • Point Series Droplines - The Point Series now supports drop lines. Drop lines are lines which extend from the point X, Y, Z value to the chart walls. Optionally drop lines can extend to the axis Min, Max value or to a user specified value (drop lines origin). 
    • Bar Connector Lines - The Bar Series now supports connector lines between adjacent bars.
    • Float Bar Connector Lines and Gantt Connector Lines - The Float Bar Series now supports connector lines between adjacent bars begin / end values. In addition it also supports Gantt connector between the bar end value and one or more bars begin values. This feature allows you to easily display Gantt charts.
    • Heat Map Contour Labels - The Heat Map Series supports annotated contours. The user can specify the formatting of the contour value (elevation), the distance between labels along the contour, whether the labels orientation must follow the contour slope, whether the label should clip the contour line it annotates and others.
    • Heat Map Cross Section - The Heat Map Series can generate a list of points that form the contour cross section which is defined by crossing the heat map with a plane defined by two points that lie on the map.
    • Grid Surface Horizontal and Vertical Cross Section - The grid surface supports extraction of the grid surface profile (cross section) which is generated by intersecting the surface with a horizontal plane or an arbitrary vertical cross plane.
    • Step Line Intersections - The Step Line series supports intersection with arbitrary X or Y value.
    • Annotation Drag Tool - The Annotation Drag Tool allows the user to interactively drag annotations attached to different chart anchors (data points, scale coordinates, legend items etc.).
    • Range Selection Drag Tool - The Range Selection Drag Tool allows the users to interactively drag and resize a range selection object.
    • Volume Selection Tool - This tool allows you to interactively select a 3D volume defined by four planes (left, top, right and bottom) that can be used later to quickly check whether a 3D point is contained in the volume enclosed by the selection planes.
    • Panel Zoom Tool - This tool allows you to interactively zoom in or out an area of the panel.
    • Better WPF Integration - Nevron Chart for WFP now has better WFP integration. The control has also has many new examples for WPF.
    • Stability and performance improvements.
Nevron Chart for .NET included in Nevron Vision for .NET.

Nevron Vision for .NET

Diseñe su aplicación con herramientas profesionales de visualización de datos.

¿Alguna pregunta?

Chatee en vivo ahora mismo con nuestros especialistas en licencias de Nevron.