AnyChart 8.2.0

Gráficos de JavaScript diseñados para ser incorporados e integrados. La versión más reciente añade un nuevo gráfico de proyección solar.
Mayo 8, 2018
Nueva versión

Características

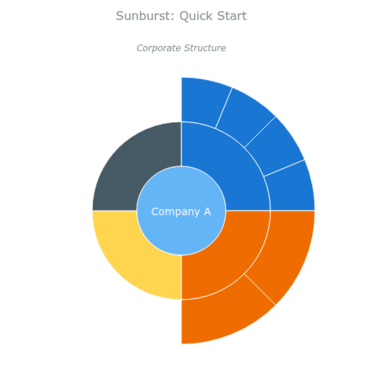
  • Sunburst Chart - Sunburst Chart (also called Radial Treemap) presents an excellent way of visualizing hierarchical data by means of concentric circles.
  • Min/Max Labels - Show minimum and maximum values on a chart. This feature allows users to see at a glance what is happening with the data.
  • Crosshair Multiple Labels - Now you can display several crosshair labels on additional axes of a chart. It is possible to add an extra axis (e.g. one with percentage values), enable this feature and get more insights into the data.
  • Negative Logarithmic Scale - This can be helpful when creating a more comprehensive visualization when working with large data sets.
New Sunburst chart

AnyChart JS

Gráficos de JavaScript diseñados para ser incorporados e integrados.

¿Alguna pregunta?

Chatee en vivo ahora mismo con nuestros especialistas en licencias de AnyChart.