Stimulsoft Ultimate 2019.1.1

Añade mejoras a los paneles y al editor de globalización.
Diciembre 19, 2018
Nueva versión

Características

  • New maps - North America, USA and Canada, South America, Oman, Qatar, and the Middle East.
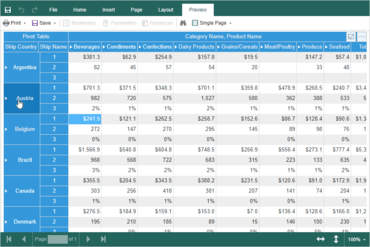
  • Pivot Tables in Dashboards.WEB - This element can be used to process, group, and sum data values by row and column.
  • CSV Export for Tables - You can now export Dashboard Table data to CSV format.
  • Updated Globalization String Editor - The Globalization String Editor has been redesigned and the ability to localize Dashboard elements has been added.
  • Interactive Charts in Dashboards.WEB - Dashboards.WEB charts can now interact with other elements.
  • Start Page in Report Designer - When launching the .NET Framework and WPF Report Designers, a start page will now be displayed. This page contains a list of reports recently opened, commands for opening a report from local or cloud storage as well as a wizard to create reports and indicator panels.
  • Formatting Dates and Times in Reports - The algorithm for analyzing dates and times in reports has been completely redesigned. Now, if a date or time format is applied to a Text component, the report engine will automatically analyze the data, highlight the date and time, and display it in the report.
  • Publishing Dashboards - This release adds a wizard for publishing dashboards. This functionality is available from the report designer.
  • Formatting Items on Dashboards - For Table elements, you can change the formatting of each column. For Indicator and Progress elements, select the item on the indicator panel and specify the format using the Text Format tool. In Charts, the formatting of axes can be changed using properties.
  • New Styles - Now the same style can be used both for report components and for elements of the dashboard.
  • Color Schemes for Series - Choose a color scheme and the values of Chart series will have a certain shade.
  • New Color Collection Editor - The Color Collection Editor has been completely redesigned simplifying the process of creating a list of color styles.
  • Dashboard Element Design - Now you can customize the appearance of each element in the indicator panel. You can change fill color and value color. Also, in Table items, you can specify font and customize the size and color of the selected column.
  • Customization of Chart Design - You can customize the design of area, axes, legends and signatures. All settings are located in the Chart property group.
  • View Settings - Now you can define the parameters for viewing Dashboards, for example, disabling the toolbar or some buttons in the viewer.
  • Settings for Placing Items - Select the element in the Report Designer and in the drop-down list check the box next to the option that you want to enable for the current item.
  • Open Button in Dashboard Preview - When previewing Dashboards you can now open the report file.
  • New Gauge Editor - This release significantly simplifies the Gauge editor in the HTML5 designer.
Pivot Tables in Dashboards.WEB

Stimulsoft Ultimate

Represente informes y paneles en sus aplicaciones.

¿Alguna pregunta?

Chatee en vivo ahora mismo con nuestros especialistas en licencias de Stimulsoft.