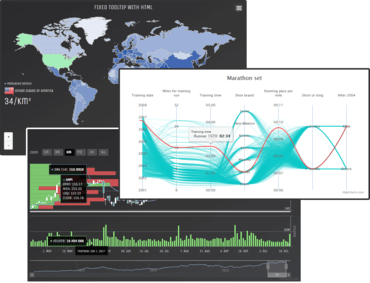
Highcharts Suite v7.1.3

Añade compatibilidad con el modo de contraste alto de Microsoft Windows.
Agosto 15, 2019
Nueva versión

Características

  • New in Highcharts v7.1.3
    • Added new 'minLinkWidth' option to sankey series.
    • Added support for 'label.formatter' callback for plot lines and plot bands.
    • Made chart credits accessible to screen readers.
    • Added support for number type in 'annotation.id'.
    • Added 'crop' and 'overflow' options for stack labels.
    • Added sensible defaults to plot lines and bands. A plot band can now be initialized with only a 'value', and a plot band with either 'from', 'to', or both.
    • Added new option 'accessibility.pointNavigationThreshold'.
    • Improved keyboard navigation for inverted charts, including bar charts.
    • Added support for Microsoft Windows High Contrast Mode. A set of styling options are automatically set using chart/series/point update when WHCM is detected. The options automatically match the OS theme, but can be overridden with the new 'accessibility.highContrastTheme' option.
    • Added 'tooltip.className' option for additional custom CSS class.
  • New in Highstock v7.1.3
    • Added new technical indicator, trendline, showing price trend.
    • Most changes listed under Highcharts 7.1.3 above also apply to Highstock 7.1.3.
  • New in Highmaps v7.1.3
    • Most changes listed under Highcharts 7.1.3 above also apply to Highmaps 7.1.3.
  • New in Highcharts Gantt v7.1.3
    • Most changes listed under Highcharts 7.1.3 above also apply to Highcharts Gantt 7.1.3.

Correcciones

  • Fixes in Highcharts 7.1.3
    • Fixed #11632, using plotOptions.series.marker.radius for all nodes in a network graph did not prevent them from being cut off.
    • Fixed #7650, hide hover points outside plot area. Fixed #11493, limit split tooltip to yAxis range.
    • Fixed #11513, arearange failed to render when the data started with NaN.
    • Fixed #7650 and #11493, points outside plot area were included as hover points, and were displayed in shared and split tooltip.
    • Fixed #11505, gauge crashed when stacking options were present.
    • Fixed #4024, stacking columns on different xAxis translated columns as in stacking on the same xAxis.
    • Fixed #11329, tooltip transform/scaling issues.
    • Fixed #11386, CSS filters were missing when chart.styledMode was enabled.
    • Fixed #11388, error when applying empty data array to histogram series.
    • Fixed #11389, inactive styles for dependency wheel series in styled mode were missing.
    • Fixed #10542, showing and hiding series now also shows and hides them from assistive technology.
    • Fixed #8608, bubble markers were hidden when Z value was missing.
    • Fixed #11156, draggable did not work with group points and boost module.
    • Fixed #11340, issue with exporting large amounts of data to CSV and XLS.
    • Fixed #10561, issue with legend click on IE11 with a11y module.
    • Fixed #11246, setting crosshair stroke-width in styled mode.
    • Fixed #8735, gapSize did not work in boost mode.
    • Fixed #10285, drag and drop module did not work with logarithmic axes.
    • Fixed #10564, issue with tabbing to legend without chart height set.
    • Fixed #11301, hovering legend item for a hidden series caused other series to get inactive state.
    • Fixed #11169, undefined value was rendered in the loading label.
    • Fixed #11244, series.update({ data }) did not preserve old options if data was passed as an array of objects.
    • Fixed #10896, class name of series label was missing in styled mode.
    • Fixed #11239, updating points in heatmap did not animate fill color.
    • Fixed #11229, negative width and height were applied to heatmap shapes.
    • Fixed #11212, selected state for a node in network graph was applied to all connected nodes.
    • Fixed #11211, calling node.update() in networkgraph series caused errors in console.
    • Fixed #10960, improved touch support on Windows devices.
    • Fixed #11176, removing all nodes and links in a network graph would throw errors with circular data.
    • Fixed #11095, updating data.switchRowsAndColumns worked only the first time.
    • Fixed #11193, downloading the chart as image used to duplicate table created by exporting.showTable option.
    • Fixed #11101, a regression causing crash on responsive chart when reverting to default options.
    • Fixed #9377, added product tags in ES-modules.
    • Fixed #11140, setting series.dataLabels.inside to true forced pie dataLabels to render as in contrast.
    • Fixed #6657, inappropriate contrast color for first and last dataLabel in column/bar series.
    • Fixed #11124, click on a node in networkgraph caused all nodes to reposition.
    • Fixed #10597, issue with series type update after drilldown.
    • Fixed #10861, a regression causing event handlers to pile up when running Chart.update or Series.update with new events options.
    • Fixed #10518, rotation.orientations = 1 in wordcloud series resulted in rotation NaN, which made the SVG rendering of the word crash.
    • Fixed #10498, a regression causing wrong chart width if a parent had transform style.
    • Fixed #11015, removing an annotation did not deselect it, causing errors.
    • Fixed #10522, series.colors was ignored in sunburst.
    • Fixed #10941, null points with the same x-value in stacking were causing wrong offset for other points.
    • Fixed #10984, networkgraph series did not render when loading data from CSV.
    • Fixed #10993, in timeline series, points were visible outside the axis extremes.
    • Fixed #10987, pareto series didn't refresh after updating baseSeries data with less than two points.
    • Fixed issues #10510 and #10594 with pattern fills.
    • Fixed #10930, sometimes data labels were not visible after zooming.
    • Fixed #10961, annotations used to block mouseDown event.
    • Fixed #10717, xAxis.reversed should reverse partialFill on xrange.
    • Fixed #10671, a regression causing crash with responsive chart.spacing settings.
    • Fixed #10699, inactive state was configured wrongly in venn series, causing bad opacity.
    • Fixed #10952, plot background did not scale to scrollable plot area.
    • Fixed #10791, disabled halo feature in Venn series. The docs said it was supported, though it didn't work well.
    • Fixed #10909, subpixel precision caused unwanted space between the area series' area and baseline grid lines.
    • Fixed #10943, TypeScript support for full-screen module (and other modules).
    • Fixed #9099, getSelectedPoints did not include the currently selected or unselected point when called from inside series.point.events.select.
    • Fixed #10874: tooltip wasn't formatted correctly for updated null points.
    • Fixed #10670, heatmap points with zones and colorAxis did not restore colors after hover.
    • Fixed #10323, on timeline series, data label's connector was hidden after setting extremes.
    • Fixed #10524, wordcloud text with multiple words had different alignment than text with a single word.
    • Fixed #10870, regression with Series.update updating marker symbol.
    • Fixed issue with the data module failing on CORS resources.
    • Fixed #10865, image markers in networkgraph used to throw errors in console.
    • Fixed #10708, removed use of Array.prototype.findIndex which would cause Sankey series to break in IE.
    • Fixed #10247, improved data label positions in venn series.
  • Fixes in Highstock 7.1.3
    • Most fixes in Highcharts 7.1.3 plus...
    • Fixed #11483, lastPrice indicator was incorrect with dataGrouping.
    • Fixed #11415, vertical scrollbar was visible in annotation popup.
    • Fixed #11175, navigation.bindings.rectangleAnnotation did not resize it's width/height according to xAxis/yAxis extremes.
    • Fixed #11174, size of measure annotation was not recalculated in redraw.
    • Fixed #10980, defining just one item in stockTools.gui.definitions[name] threw errors.
    • Fixed #11191, dataGrouping.approximation.average did not correct floating point precision errors.
    • Fixed #10745, sometimes old points were not removed after updating data with enabled dataGrouping.
    • Fixed #11366, annotationOptions did not work for some of the bindings[annotationName].
    • Fixed #11351, gapSize and multiple dataGroupings sometimes hide series line with lower granularity.
    • Fixed #11344, some icons were not loaded from custom url. Added new general option, navigation.iconsURL that takes over from the more specific stockTools.gui.iconsURL.
    • Fixed #11206, editing technical indicators in stock tools did not select correct series.
    • Fixed #11079, stock-tools were not working correctly in inverted charts.
    • Fixed #11005, X axis line width affected clipping of the series graph or columns, even when the Y axis did not extend to the X axis.
    • Fixed #10827, issues with the TEMA indicator's tooltip and boost module. Caused by a method name collision.
    • Fixed #10932, xAxis.minPadding didn't work when plotOptions.series.dataGrouping was enabled.
  • Fixes in Highmaps 7.1.3
    • Most fixes in Highcharts 7.1.3.
  • Fixes in Highcharts Gantt 7.1.3
    • Most fixes in Highcharts 7.1.3 plus...
    • Fixed #10887, regression with Axis.update() in Treegrid axis.
    • Fixed #10942, progress indicator was not redrawn after collapsing and expanding nodes.
    • Fixed #10804, navigator affected the positions of the gantt dependencies negatively.
Highcharts Suite

Highcharts Suite

Haga que sus datos cobren vida.

¿Alguna pregunta?

Chatee en vivo ahora mismo con nuestros especialistas en licencias de Highsoft.