Proveedor oficial
Como distribuidores oficiales y autorizados, le suministramos licencias legítimas directamente de más de 200 editores de software.
Ver todas nuestras marcas.

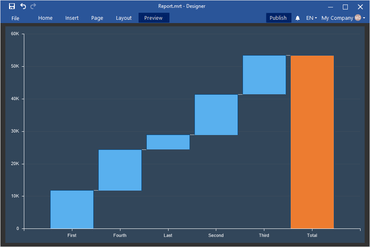
Un generador de informes fácil de usar para JavaScript.
Chatee en vivo ahora mismo con nuestros especialistas en licencias de Stimulsoft.