ActiveReportsJS V3.0

Agrega el nuevo Chart Wizard y capacidad para exportar datos producidos por las regiones de datos Table y Tablix.
Febrero 9, 2022
Nueva versión

Características

  • Tabular Data Export
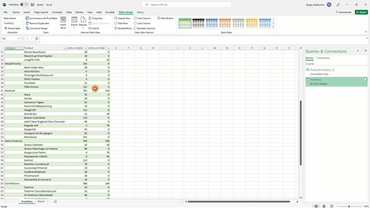
    • Sometimes you might want to export report data for further processing. To solve this problem, this release introduces Tabular Data Export. Currently, it supports CSV output format and exports data produced by Table and Tablix data regions.
    • If a report contains multiple tables or tablices, the Tabular Data Export can optionally produce multiple files and put them into a single ZIP archive. You can easily import the output of the Tabular Data Export into a Microsoft Excel table.
  • Performance Enhancements - ActiveReportsJS v3.0 improves the performance of several date operations and reports that use dates extensively are now up to 30% faster:
    • Parsing dates from the report data. ActiveReportsJS only supports the JSON data format that preserves dates as strings.
    • Formatting dates so that the report output display them as desired.
    • Extracting date parts, such as month or year.
  • Chart Wizard - Brand new Chart Wizard allows you to create advanced charts in just a few clicks.
  • Image Data URLs Support - Data URLs allow us to embed images inline in report data. ActiveReportsJS now supports Data URLs for the Image Report Item with the External Source.
    • If a dataset contains fields whose values are image data URLs then you can set the Value property of the Image Report Item to the field reference, the Source property to External, and the MimeType property to the type of the image - image/png for PNG images, image/jpeg for JPEG images, and image/svg+xml for SVG images.
Tabular Data Export

ActiveReportsJS

Solución de informes de JavaScript para aplicaciones web.

¿Alguna pregunta?

Chatee en vivo ahora mismo con nuestros especialistas en licencias de MESCIUS (formerly GrapeCity).