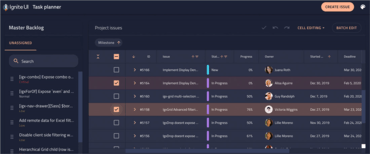
Infragistics Ignite UI 22.1

Mejoras y nuevos controles para Angular, Blazor y React.
Junio 16, 2022
Nueva versión

Características

Ignite UI for Angular

  • Added support for Angular 14.
  • Angular Pivot Grid
    • The Angular Pivot Grid Component displays data in a pivot table that helps perform complex analysis on the supplied data set. Features include:
      • Dimensions filtering.
      • Dimensions sorting.
      • Dimensions resizing.
      • Dimensions selection.
      • Super Compact Mode.
      • Additional summary column.
      • Dimensions drag & drop.
    • Angular Pivot Grid Remote Operations - There are scenarios where the pivot data is already grouped and aggregated from a remote service and there's no need for further processing on the client side, the pivot grid can be configured to use a custom empty strategy that will skip data processing on the client and allow it to directly display the data as is.
  • Angular Tree Grid
    • Microsoft Excel Style Filter: Tree Filter View - By default, the Excel Style Filtering dialog displays the items in a list view. In some business use cases you can take advantage of cascade selection and have all children selected by default. In order to display them in a tree view you can use the TreeGridFilteringStrategy and specify an array of column field names. Filter items will be displayed in a tree view for the specified columns and in a list view for all other columns.
  • Angular Tabs
    • Added RTL support.
  • Angular Grid
    • Summary custom templating - With Summary Custom Templating you are now able to customize height, size, color, font and styles of igxSummary according your clients needs.
  • Angular Data Grid
    • Added a new Angular Data Grid Sorting option: single and multiple - The sortingOption property allows you to set either single or multiple sorting mode. When single mode is enabled you can sort one column at a time. The default value of the property is multiple. Sorting and grouping expressions are now working separately. If grouping and sorting expressions are in a conflict, grouping expressions take precedence.
  • Angular Slider
    • Added support for double value binding - The Ignite UI for Angular Slider is a form component which allows selection in a given range by moving a thumb along a track. The track can be defined as continuous or stepped and the slider can be configured so users can choose between single value and range (lower and upper value) slider types.
  • Angular Drag and Drop
    • Added support for window scroll when dragging an element to its edges - Added the new scrollContainer property that can specify specific the element that should be scrolled instead of window for custom solutions.

Ignite UI for Blazor

  • Blazor Dock Manager (Preview)
    • Provides a way to manage complex layouts using different types of panes with various sizes, positions and behavior, that can be docked to various locations within an app. The dock manager allows end-users to customize it further by pinning, resizing, moving, floating, and hiding panes.
  • Blazor Grid
    • Added support for pagination - Pagination is used to split a large set of data into a sequence of pages that have similar content. With pagination, data can be displayed in a set number of rows, letting users “scroll” through their data, without needing a scroll bar. The UI for table pagination usually includes things like the current page, total pages, and clickable Previous and Next arrows/buttons that let users flip through the pages of data.
  • Blazor Data Visualization
    • Improved the chart component - Including new defaults for the look and feel of the charts and new features across all of the data visualization components. New features include:
      • Auto-Label Rotation.
      • Enhanced Margin Computation.
      • Properties for Label Gaps.
      • Positioning in Callout Layers.
      • Style Events.
      • New Highlighting Series Modes.
      • Horizontal & Vertical Scrollbars.
      • Margin Angle Modes.
    • Added two brand new data visualization components:
      • Data Legend - The Data Legend is a new component that is similar to the Legend, but it focuses more on showing the values of series, the legend badges, and the series titles.
      • Data Tooltip - The Data Tooltip is a new type of tooltip layer that displays detailed information about a series including values, legend badge and series title. Essentially, this tooltip displays a Data Legend as its content. Therefore, it will have the same styling, formatting, and filtering properties as the Data Legend component.
  • Blazor Chip
    • The Chip component is a small container of information. Chips can contain text, avatars, images, icons, and more. Chips are commonly used as tags, filters, choices, and providing input to an application. The Chip component is highly customizable and supports selection, removing, as well as adding other components as either a prefix or suffix.
  • Blazor Drop Down
    • The Blazor Drop Down component displays a toggleable list of predefined values and allows users to easily select a single option item with a click. It can be quickly configured to act as a drop-down menu or you can simply use it to deliver more useful visual information by grouping data. With grouping you can use both flat and hierarchical data.
  • Blazor Mask Input
    • The Blazor Mask Input is an enhanced input component that provides an easy and reliable way to collect end-user input:
      • Masks allow you to require input characters, optionally accept input characters, and define the type of character that is expected at a specific position in the Mask Input.
      • By using a mask, you can easily distinguish between a proper and an improper user input value. This means you can validate the input provided by the user and notify the user of any errors.
      • Common masks include phone numbers, credit card numbers, social security numbers, dates, and many more.
  • Blazor Progress Bar - Linear and Circular
    • The Blazor Linear Progress Bar component provides a visual indicator of an application’s process as it changes. This can include processes like loading data from a database, uploading a file, or making a web service call.
      • You can use the Progress Bar to visually inform your end-users about the progress of a long running task or a series of steps. This is commonly done by showing a percentage of the process that increments as it gets closer to completing.
      • Sometimes, the time to complete a long running task is unknown. To support this scenario, the Progress Bar supports an “Indeterminate” mode. Instead of reporting a specific value of completion, the Progress Bar animation will continue to loop until the process has completed.
  • Blazor Rating
    • The Blazor Rating component allows your end-users to select a rating value from a group of visual symbols such as stars. The Rating component is often used to provide insight regarding the opinions and experiences of users for products and services they may have used or purchased.
  • Blazor Slider and Range Slider
    • The Blazor Slider component is a type of input control that allows selecting a value by moving the thumb along a track within a given range of values. The track can be defined as continuous or stepped. The Slider components provides a set of configurable features such as labels, tick marks, tooltips, constraints, and custom styling.
    • The Blazor Range Slider is almost identical to the Slider component. The only difference being that you can select a range of values instead of a single value. Selecting a range of values is done by moving two independent thumbs along a track within a range of given values. One thumb will represent the first value of the selected range, while the second thumb will represent the last value of the selected range.
  • Blazor Snackbar
    • The Blazor Snackbar component is used to show a brief message or notification within the application which may require feedback from the end-user. A common use-case for the Snack Bar component is to inform an end-user that a record has been deleted, and then provide an option to undo the delete operation to restore the record.
  • Blazor Toast
    • The Blazor Toast component is used to display an alert or notification on the current page. Common notifications include system messaging, push notifications, warning messages, information, and other non-interactive notifications. The Toast component is usually shown at the bottom of the screen and disappears automatically after a set period of time. It is important to note that the Toast component cannot be dismissed by the end-user.

Ignite UI for jQuery

  • Added new Data Legend component - The igDataLegend is a new component that works much like the Legend component, but it shows values of series and provides several configuration properties for filtering series rows and value columns, styling and formatting. This legend updates when the mouse is moved inside the plot areas of various chart controls.
  • Added new Data Tooltip Layer - The DataToolTipLayer is a new annotation layer that displays the values and titles of series as well as legend badges in a tooltip.
    • It provides several configuration properties for filtering series rows and value columns, styling and formatting.
    • The tooltip's value updates when the mouse is moved inside the plot area of various chart controls.
    • The DataToolTipLayer is now the default tooltip type for each chart controls.
  • Improved Chart Features:
    • Data Chart:
      • Added animation and transition-in support for Stacked Series. Animations can be enabled by setting the IsTransitionInEnabled property to true. From there, you can set the TransitionInDuration property to determine how long your animation should take to complete and the TransitionInMode to determine the type of animation that takes place.
    • Category Chart, Financial Chart and DataChart:
      • Added AssigningCategoryStyle event which is now available for all series in DataChart. This is used when you want to conditionally configure aspects of series items such as fill background-color or highlighting.
      • Added new AllowedPositions enumeration property to CalloutLayer. This is used to limit where callouts are to be placed within a chart.
      • Added new corner radius properties to Annotation Layers. These are used to round-out the corners of each the callouts.
      • Added new HorizontalViewScrollbarMode and VerticalViewScrollbarMode enumeration properties to enable scrollbars in various ways. When paired with IsVerticalZoomEnabled or IsHorizontalZoomEnabled, you'll be able to persist or fade-in and out the scrollbars along the axes to navigate the chart.
      • Added new FavorLabellingScaleEnd which determines whether an axis should favor emitting a label at the end of the scale.
      • Added new IsSplineShapePartOfRange which determines whether to include the spline shape in the axis range requested of the axis.
      • Added new XAxisMaximumGap which determines the maximum allowed value for the plotted series when using XAxisGap. The gap determines the amount of space between columns or bars of plotted series.
      • Added new XAxisMinimumGapSize which determines the minimum pixel-based value for the plotted series when using XAxisGap to ensure there is always some spacing between each category.

Ignite UI for React

  • Added 15 new React controls:
    • React Avatar - The React Avatar component helps you add initials, images, or material icons to your application.
    • React Badge - The React Badge is a component used in conjunction with avatars, navigation menus, or other components in an application when a visual notification is needed. Badges are usually designed as icons with a predefined style to communicate information, success, warnings, or errors.
    • React Button - The React Button directive is intended to turn any button, span, div, or anchor element into a fully functional button.
    • React Calendar - The React Calendar component provides an easy and intuitive ways to display date information. Users can choose from three different selection modes - single selection, multi selection or range selection.
    • React Card - The React Card component displays text, images, icons, and buttons in a visually rich presentation that can serve as an entry point to more detailed information.
    • React Checkbox - The React Checkbox component is a selection control that allows users to make a binary choice for a certain condition. It behaves similarly to the native browser checkbox.
    • React Icon - The React Icon component unifies icon/font families so developers can use them interchangeably and add material icons to markup.
    • React Input - The React Input is used to create single-line or multi-line text elements. They help to cover common scenarios when dealing with form inputs.
    • React List - The List component is extremely useful when presenting a group of items. You can create a simple list of textual items, or a more complex one, containing an array of different layout elements. The React List component displays rows of items and supports one or more header items. Each list item is completely templatable and will support any valid HTML.
    • React Navigation Bar - The React Navigation Bar component informs the user of their current position in an app and helps them move back (much like the “back” button in a browser). The Navigation Bar can also provide links to quick actions such as search or favorite, helping users navigate smoothly through an application without trying to move to invalid routes or states. The bar sits at the top of the container it is placed in.
    • React Navigation Drawer - The React Navigation Drawer component is a side navigation container. It can rest above content and slide in/out of view or be pinned to expand/collapse within the content. A mini version provides quick access to navigation even when closed. The Navigation Drawer features responsive mode selection and touch gestures. Content is completely customizable and can make use of default menu item styling.
    • React Radio and Radio Group - The React Radio Button and Radio Group components allow the user to select a single option from an available set of options that are listed side by side.
    • React Ripple - The React Ripple component creates an animation in response to a touch or a mouse click.
    • React Switch - The React Switch component functions like a checkbox but explicitly represents boolean on and off states. Clicking the Switch component will toggle the value of the component from an “on” state (boolean true) to an “off” state (boolean false).

Ignite UI for Web Components

  • Web Components Grid
    • Added support for pagination - Pagination is used to split a large set of data into a sequence of pages that have similar content. With pagination, data can be displayed in a set number of rows, letting users “scroll” through their data, without needing a scroll bar. The UI for table pagination usually includes things like the current page, total pages, and clickable Previous and Next arrows/buttons that let users flip through the pages of data.
  • Web Components Data Visualization
    • Improved the chart component - Including new defaults for the look and feel of the charts and new features across all of the data visualization components. New features include:
      • Auto-Label Rotation.
      • Enhanced Margin Computation.
      • Properties for Label Gaps.
      • Positioning in Callout Layers.
      • Style Events.
      • New Highlighting Series Modes.
      • Horizontal & Vertical Scrollbars.
      • Margin Angle Modes.
    • Added two brand new data visualization components:
      • Data Legend - The Data Legend is a new component that is similar to the Legend, but it focuses more on showing the values of series, the legend badges, and the series titles.
      • Data Tooltip - The Data Tooltip is a new type of tooltip layer that displays detailed information about a series including values, legend badge and series title. Essentially, this tooltip displays a Data Legend as its content. Therefore, it will have the same styling, formatting, and filtering properties as the Data Legend component.
  • Web Components Chip
    • The Chip component is a small container of information. Chips can contain text, avatars, images, icons, and more. Chips are commonly used as tags, filters, choices, and providing input to an application. The Chip component is highly customizable and supports selection, removing, as well as adding other components as either a prefix or suffix.
  • Web Components Drop Down
    • The Web Components Drop Down component displays a toggleable list of predefined values and allows users to easily select a single option item with a click. It can be quickly configured to act as a drop-down menu or you can simply use it to deliver more useful visual information by grouping data. With grouping you can use both flat and hierarchical data.
  • Web Components Expansion Panel
    • The Web Components Expansion Panel is a lightweight accordion component which can be rendered in two states - collapsed or expanded. The expansion panel can be toggled using mouse click, or keyboard interactions.
  • Web Components Mask Input
    • The Web Components Mask Input is an enhanced input component that provides an easy and reliable way to collect end-user input:
      • Masks allow you to require input characters, optionally accept input characters, and define the type of character that is expected at a specific position in the Mask Input.
      • By using a mask, you can easily distinguish between a proper and an improper user input value. This means you can validate the input provided by the user and notify the user of any errors.
      • Common masks include phone numbers, credit card numbers, social security numbers, dates, and many more.
  • Web Components Progress Bar - Linear and Circular
    • The Web Components Linear Progress Bar component provides a visual indicator of an application’s process as it changes. This can include processes like loading data from a database, uploading a file, or making a web service call.
      • You can use the Progress Bar to visually inform your end-users about the progress of a long running task or a series of steps. This is commonly done by showing a percentage of the process that increments as it gets closer to completing.
      • Sometimes, the time to complete a long running task is unknown. To support this scenario, the Progress Bar supports an “Indeterminate” mode. Instead of reporting a specific value of completion, the Progress Bar animation will continue to loop until the process has completed.
  • Web Components Rating
    • The Web Components Rating component allows your end-users to select a rating value from a group of visual symbols such as stars. The Rating component is often used to provide insight regarding the opinions and experiences of users for products and services they may have used or purchased.
  • Web Components Slider and Range Slider
    • The Web Components Slider component is a type of input control that allows selecting a value by moving the thumb along a track within a given range of values. The track can be defined as continuous or stepped. The Slider components provides a set of configurable features such as labels, tick marks, tooltips, constraints, and custom styling.
    • The Web Components Range Slider is almost identical to the Slider component. The only difference being that you can select a range of values instead of a single value. Selecting a range of values is done by moving two independent thumbs along a track within a range of given values. One thumb will represent the first value of the selected range, while the second thumb will represent the last value of the selected range.
  • Web Components Snackbar
    • The Web Components Snackbar component is used to show a brief message or notification within the application which may require feedback from the end-user. A common use-case for the Snack Bar component is to inform an end-user that a record has been deleted, and then provide an option to undo the delete operation to restore the record.
  • Web Components Toast
    • The Web Components Toast component is used to display an alert or notification on the current page. Common notifications include system messaging, push notifications, warning messages, information, and other non-interactive notifications. The Toast component is usually shown at the bottom of the screen and disappears automatically after a set period of time. It is important to note that the Toast component cannot be dismissed by the end-user.
  • Web Components Tree
    • The Web Components Tree component allows users to represent hierarchical data in a tree-view structure, maintaining parent-child relationships, as well as to define static tree-view structure without a corresponding data model. Its primary purpose is to allow end-users to visualize and navigate within hierarchical data structures. The Tree component also provides load on demand capabilities, item activation, bi-state and cascading selection of items through built-in checkboxes, built-in keyboard navigation and more.
Infragistics Ignite UI

Infragistics Ignite UI

Cree rápidamente aplicaciones web de ejecución rápida.

¿Alguna pregunta?

Chatee en vivo ahora mismo con nuestros especialistas en licencias de Infragistics.