Infragistics Ultimate UI for Windows Forms 22.1

Data Chart agrega compatibilidad con animación y transición para series apiladas.
Junio 16, 2022
Nueva versión

Características

  • Added new Data Legend component - The UltraDataLegend is a new component that works much like the Legend component, but it shows values of series and provides several configuration properties for filtering series rows and value columns, styling and formatting. This legend updates when the mouse is moved inside the plot areas of various chart controls.
  • Added new Data Tooltip Layer - The DataToolTipLayer is a new annotation layer that displays the values and titles of series as well as legend badges in a tooltip.
    • It provides several configuration properties for filtering series rows and value columns, styling and formatting.
    • The tooltip's value updates when the mouse is moved inside the plot area of various chart controls.
    • The DataToolTipLayer is now the default tooltip type for each chart controls.
  • Data Chart:
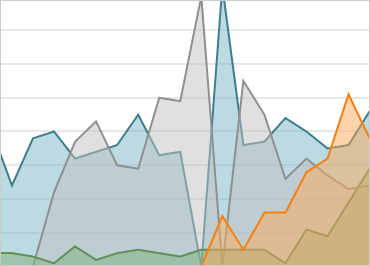
    • Added animation and transition-in support for Stacked Series. Animations can be enabled by setting the IsTransitionInEnabled property to true. From there, you can set the TransitionInDuration property to determine how long your animation should take to complete and the TransitionInMode to determine the type of animation that takes place.
  • Category Chart, Financial Chart and Data Chart:
    • Added AssigningCategoryStyle event which is now available for all series in DataChart. This is used when you want to conditionally configure aspects of series items such as fill background-color or highlighting.
    • Added new AllowedPositions enumeration property to CalloutLayer. This is used to limit where callouts are to be placed within a chart.
    • Added new corner radius properties to Annotation Layers. These are used to round-out the corners of each the callouts.
    • Added new HorizontalViewScrollbarMode and VerticalViewScrollbarMode enumeration properties to enable scrollbars in various ways. When paired with IsVerticalZoomEnabled or IsHorizontalZoomEnabled, you'll be able to persist or fade-in and out the scrollbars along the axes to navigate the chart.
    • Added new FavorLabellingScaleEnd which determines whether an axis should favor emitting a label at the end of the scale.
    • Added new IsSplineShapePartOfRange which determines whether to include the spline shape in the axis range requested of the axis.
    • Added new XAxisMaximumGap which determines the maximum allowed value for the plotted series when using XAxisGap. The gap determines the amount of space between columns or bars of plotted series.
    • Added new XAxisMinimumGapSize which determines the minimum pixel-based value for the plotted series when using XAxisGap to ensure there is always some spacing between each category.
Stacked chart example.

Infragistics Ultimate UI for Windows Forms

Un conjunto de más de 100 controles de interfaz de usuario de formularios Windows le permite crear rápidamente interfaces de usuario con estilos con que ofrecen experiencias superiores.

¿Alguna pregunta?

Chatee en vivo ahora mismo con nuestros especialistas en licencias de Infragistics.