Proveedor oficial
Como distribuidores oficiales y autorizados, le suministramos licencias legítimas directamente de más de 200 editores de software.
Ver todas nuestras marcas.
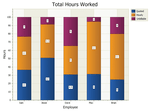
Descripción: provides several charting styles to choose from including Bar, Point, Line, Pie, Radar / Polar, Area, Financial, Gantt, Funnel / Pyramid, Graphing and Analysis with many features available. Chart Pro is ... be added to your project with only a few lines of code. All charts are fully customizable allowing you to create virtually any charting style. Features Overview Codejock Chart Pro for Visual C++ MFC ... Builder Utility Combines Series Line Styles Markup Title Support DateTime Scale Logarithmic Scale Virtual Points Graphing Control Flow Graph Analysis Trend Lines Error Bars ...
Notas de la versión: Improves zooming in FlowGraph component. FlowGraph points made to keep their size fixed regardless of zoom level. Blurry chart elements when Markup is enabled and used have been fixed. Missing axis ...

Descripción: to choose from including Bar, Point, Line, Pie, Radar / Polar, Area, Financial, Gantt, Funnel / Pyramid, Graphing and Analysis with many features available. Chart Pro is included in Toolkit Pro for Visual C++ ... Use popular chart types to visualize your data and create custom dashboards for desktop applications. Codejock Chart Pro for Visual C++ MFC is easy to use and can be added to your project with only ... a few lines of code. All charts are fully customizable allowing you to create virtually any charting style. Features Overview Codejock Chart Pro for Visual C++ MFC provides several charting styles ...
Notas de la versión: Chart freezing when too large or too small values are used has been fixed. Missing error bar chart line color and style setters has been added. ...
Notas de la versión: Wrong chart axis origin for negative values has been fixed. Samples and Utilities: Native Windows theme support has been fixed. ...
Notas de la versión: Samples and Utilities: Improved DPI support for most samples. Memory leaks on closing a 3D chart have been fixed. ...
Notas de la versión: Adds 3D chart transparency and optional antialising. Added Funnel3D chart style. Added 3D chart transparency and optional antialising. Improved DPI compatibility of several chart fonts. ...
Notas de la versión: Adds support 3D Pyramid charts. Support for Visual Studio 2019. Utility and Samples- Codejock samples and utilities have been significantly improved and applied a modern look so that you are able ... to not only work more efficiently with the tools. 3D Pyramid Chart- 3D pyramid chart support has been added. Toolkit Pro Application Wizard ...
Notas de la versión: Adds Radar X Axis clockwise and counter-clockwise directions. Added Radar X Axis clockwise and counter-clockwise directions. ...
Notas de la versión: Fixed issue saving and loading chart series with Gradient fill style. Fixed issue saving and loading chart series with Gradient fill style. ...
Notas de la versión: New 3D styles added for Pie, Doughnut and Torus chart types, plus support for Microsoft Visual Studio 2017. Visual Studio 2017 support added. New 3D styles added for Pie, Doughnut and Torus chart ...
Notas de la versión: Maintenance release includes several bug fixes. Gantt chart XML loading from 16.3.1 version fixed. CXTPChartMarker::CreateDeviceCommand made virtual. ...
Notas de la versión: of CXTPChartDiagram2DSeriesStyle::SetSecondaryAxisX() and SetSecondaryAxisY(). For ActiveX added methods ChartDiagram2D.AxisXByIndex and AxisYByIndex to get appropriate axis by index. Fixed getting the color of axis in ActiveX Chart control. Issue ...
Notas de la versión: Updates in v17.1 Static analysis warning fixed in XTPChartDefines.h. ...
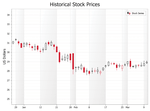
Capturas de pantalla: A Candlestick Chart is used to display trends for financial data, generally stock market prices. Candlestick charts are much easier to rear than a traditional bar chart to a stock market trader. ...
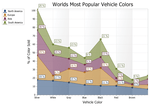
Capturas de pantalla: A Stacked Area chart is very similar to an area chart. Data is displayed using different colors in the "area" below the line. Each series of points is represented with a different color. ... Area charts are commonly used to display accumulated values over a period of time. ...
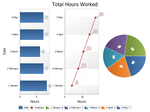
Capturas de pantalla: Using the supplied "Chart Builder" tool you can build your charts using a WYSIWYG editor to customize the colors, etc. and export them to an xml file that can then be loaded into the chart ...

Capturas de pantalla: A bubble chart is just a variation of a point chart, only it displays bubbles of the data points. Data in displayed in a grid using Cartesian coordinates. Data is displayed along the x and y axis, ...
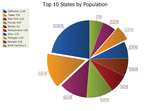
Capturas de pantalla: A pie chart displays a series of data as "slices" of a "pie". The data in the pie chart will be divided up into slices, each represents a percentage of the pie. The size ...
Precios: ...