Proveedor oficial
Como distribuidores oficiales y autorizados, le suministramos licencias legítimas directamente de más de 200 editores de software.
Ver todas nuestras marcas.
Notas de la versión: Legend memory leak issue fixed. Connect missing points issue fixed. Timeline chart useHtml axis labels issue fixed. Timeline chart zoom issue fixed. 0 ...
Notas de la versión: Added Interactivity Events in Calendar and Circle Packing Charts- Calendar and Circle Packing charts have been upgraded by integrating a comprehensive suite of interactivity events. You can now attach event listeners to any chart element, triggering ...
Notas de la versión: Surface chart markers zIndex issue fixed. Network Graph arrows issue fixed. Surface droplines serialization issue fixed. Surface csv export issue fixed. Label annotation issue fixed. 0 ...

Notas de la versión: Adds the ability to position Y and X axes anywhere on a chart. Cross-axis settings- Now allows you to position Y and X Axes anywhere on a chart- not only fixed Top/Left/Bottom/Right positions. Waterfall outside labels- Waterfall charts now have outside ...

Notas de la versión: Adds new Calendar and Circle Packing charts. Waterfall Arrows- Allows you to add Arrow shaped connectors between different parts along with labels to show changes. Calendar Chart- A calendar chart is a visualization used to show activity over the course ...
Notas de la versión: Adds an option to limit the number of characters in labels for easier control over chart display. Labels text length- Added an option to limit the number of characters in labels for easier control over the chart display. Client-side CSV/XLSX export- CSV ...

Notas de la versión: Adds option to tune text shadows on charts Text shadow effect- Added option to tune text shadows on charts with the textShadow() method. Background corner settings can now be set in percent as well as in pixels Sunburst label performance significantly ...
Notas de la versión: Adds legend item alignment settings. Added the ability to disable credits over a theme. Added legend item alignment settings. Client-side export issue. Hover cursor on legend. Selection Marquee issue. Log scale ticks issue. Sunburst label issue. Mobile ...
Notas de la versión: Save your data visualizations as images (SVG, PNG, and JPG) and PDF documents without a roundtrip to the server. Client-Side Export- This release adds client-side export to all JavaScript charting libraries- AnyChart, AnyStock, AnyGantt, and AnyMap. This ...

Notas de la versión: Adds Timeline Chart and Network Graph. Timeline Chart- A timeline is a display of a list of events in chronological order. It is typically a graphic design showing a long bar labeled with dates paralleling it, and usually contemporaneous events. Network ...

Notas de la versión: Visualize of a set of words in a hierarchical Word Tree. Word Tree- A Word Tree chart is a visualization of a set of words in a hierarchical way. It can be used to show which words most often follow or precede a target word or to show a hierarchy of terms ...

Notas de la versión: Adds support for Sankey diagrams, flow diagrams that show nodes linked by flows, the quantity of each flow being represented as its width. Sankey Diagram- A Sankey diagram is a flow diagram that shows nodes linked by flows, the quantity of each flow being ...

Notas de la versión: Adds several new ways to customize the coloring of chart series. HTML Tooltips Support- Tooltip customization is way easier now. Full support of HTML is available and you can write your own HTML code and customize tooltip visualization using CSS classes. ...

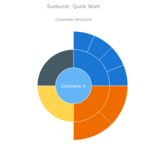
Notas de la versión: Adds new Sunburst chart. Sunburst Chart- Sunburst Chart (also called Radial Treemap) presents an excellent way of visualizing hierarchical data by means of concentric circles. Min/Max Labels- Show minimum and maximum values on a chart. This feature allows ...