Proveedor oficial
Como distribuidores oficiales y autorizados, le suministramos licencias legítimas directamente de más de 200 editores de software.
Ver todas nuestras marcas.

Capturas de pantalla: Let's you browse and filter the queries by their isolation level. 0 ...
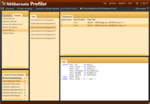
Capturas de pantalla: Let's you see what queries were executed for each of your URLs. 0 ...
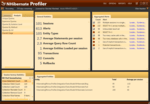
Capturas de pantalla: View overall statistics for the selected session. 0 ...
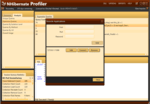
Capturas de pantalla: Connect to your production application and use Nhibernate Profiler to profile it. 0 ...

Capturas de pantalla: You can export all the data that the profile collects to an HTML file, which you can send to your DBA for data analysis. 0 ...
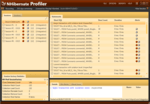
Capturas de pantalla: See all statements across all the object contexts that your application created. 0 ...
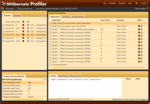
Capturas de pantalla: See all the statements of a specific session. 0 ...
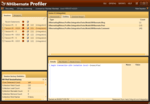
Capturas de pantalla: Shows which entities were loaded in the selected session. 0 ...
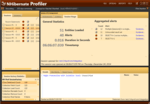
Capturas de pantalla: See statistics information about the current session. 0 ...
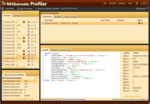
Capturas de pantalla: Shows the actual SQL details that NHibernate generates under the hood in a readable and convenient way. 0 ...
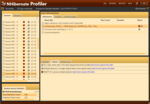
Capturas de pantalla: Inspect your statements for NHibernate misuse, any detected will be added to the alerts tab. 0 ...
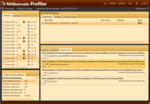
Capturas de pantalla: Let's you examine the stack traces of the code paths that executes the selected statement. You can click on any stack trace in order to open the relevant code in Visual Studio. 0 ...
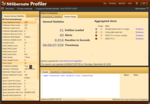
Capturas de pantalla: See the full lists of the Session factories that your application created. 0 ...
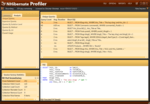
Capturas de pantalla: Let's you see all the unique queries ordered by the number of times executed. 0 ...
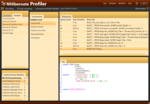
Capturas de pantalla: Let's you browse and filter the queries by their isolation level. 0 ...
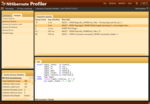
Capturas de pantalla: Let's you see all the queries ordered by the duration taken for the query to execute. 0 ...